Showing posts with label Covid-19. Show all posts

Thursday, 29 February 2024

Calculating Excess Deaths – Problems with the New U.K. Methodology

Calculating Excess Deaths – Problems with the

 New U.K. Methodology

Below are some concerns about the latest U.K. modelling of “excess deaths”. The general point I am making is that the new method seems to be answering a question (forecasting current year-over-year changes in unexpected deaths) that is peripheral to the research question that everyone is asking:

Why are excess deaths so high:

  • now in the post-Covid period (much of 2022, 2023, 2024),

  • compared to what they were during the main Covid (2020,2021, some of 2022)

  • and before Covid (say 2015-2019))?

A quick note about me, the analyst who wrote this critique: I worked for about 40 years as a statistician/data scientist, splitting my time between the Ontario provincial government in Canada and a large western Canadian research university. That time included using and developing population projection methods, building regression models, and developing specialized mathematical modelling techniques. Not to mention, plenty of descriptive reporting.

Naturally, these are my opinions and don't represent the views of past or present employers.  In a follow-up blog, I will use the numbers provided by ONS to estimate the changes in death rates during these periods, and compare the latter periods to the former.

Problems with the new Model

The bolded comments are from the document Estimating excess deaths in the UK, methodology changes: February 2024 (Office of National Statistics, United Kingdom).  In a few places, I have added underscores for emphasis. My comments follow in non-bold type.

  • “This statistical model provides the expected number of deaths registered in the current period, if trends in mortality rates remained with the same as those from recent periods and in the absence of extraordinary events affecting mortality, such as the peak of the coronavirus (COVID-19) pandemic.”

    • This is not the question in most people’s minds. With this model, a portion of the rise in deaths due to Covid, Covid lock-downs and Covid vaccines becomes “baked in the cake” and this are no longer considered excess deaths. They are the new normal. Thus, the effects of Covid, Covid lock-downs and Covid vaccines on the death counts is attenuated by the method and partially obscured.

  • “Each model is fitted to five years of data with a lag of one year from the end of the fitting period to the current period, so the expected number deaths in each week or month has its own five-year baseline period. For example, when estimating the expected number of deaths in January 2024, the model will be fitted to data spanning February 2018 to January 2023.”

    • Problem: With this method, increased deaths in 2023 (for example) are diminished in importance. Deaths in the years 2018 to 2023 are now normalized, so that excess deaths in 2023 are reduced, since the new calculation “expects” them, based on the deaths in the previous 5 years, which were high by historical standards.

    • So, this method answers a research question that is not the research question that interests most people (i.e. how does the number of deaths in 2023 compare with the number of deaths during the pre-pandemic period, This gives an (admittedly rought) indication of the effects of the pandemic, pandemic lock-downs and pandemic vaccinations. The new method might be useful for forecasting excess deaths, from one year to the next, but that’s not the main thing that interests most people.

  • “When using a quasi-Poisson regression model, modelling the number of deaths as the dependent variable, and including the natural logarithm of population size as an offset term is analogous to modelling the mortality rate in each age-sex-geography stratum.”

    • As noted above, this modelling may be useful for current year planning purposes, but it doesn’t address the main issue, which is how did the death counts differ from pre-pandemic years, to pandemic years, to post-pandemic years. For most people, that is the main concern. The method tends to reduce the “excess deaths” count, which raises suspicions. i.e. is that the real intent of the new methodology?

    • It is akin to a population projection model, which is a valid tool, but does not lead to understanding of the dynamics driving the process (in this case, long-Covid, Covid lock-down side effects and Covid vaccine adverse efficts).

  • “In our current approach to estimating excess deaths in England and Wales, and that of the devolved administrations of Scotland and Northern Ireland, the expected (baseline) number of deaths is estimated as the average number of deaths registered in a recent five-year period. In contrast, our new methodology is based on age-specific mortality rates rather than death counts, so trends in population size and age structure are accounted for. Furthermore, the five-year average mortality rate is adjusted for a trend, so historical changes in population mortality rates are also accounted for.”

    • The use of a “time-trend” variable such as this one, seems to ‘hand-wave’ away and obscure the point in question, which is precisely the “historical changes in population mortality rates”. What are the trends and what is causing them?

  • “The new and current methods produce estimates of excess deaths with similar trends and seasonal patterns over the nine-year period before the coronavirus pandemic, 2011 to 2019 (Figure 1). From 2011 to 2013, estimates from the new method are generally higher than those from the current method. However, estimates from the new method are consistently lower than those from the current method from 2015 onwards, particularly in 2019.”

    • People will naturally be suspicious of a new methodology that results in more unexpected deaths in the pre-pandemic period and fewer unexpected deaths in the pandemic and post-pandemic periods. This will lead to speculations that the government is trying to diminish concerns and therefore partially absolve itself of responsibility for increased excess deaths in the latter periods (which are the periods that people actually care about).

  • “The new and current methods estimate similar numbers of excess deaths during the pandemic (Figure 2). In particular, the two approaches produce similar peaks in estimated excess mortality in the second quarter of 2020 and the winter of 2020 to 2021. However, estimates from the new method are generally lower than those from the current method throughout the latest year, 2023, by an increasing amount.”

“On an annual basis, the new method estimates 76,412 excess deaths in the UK in 2020, compared with 84,064 estimated by the current method (Table 2). For context, the highest number of excess deaths estimated by the new method over the nine years before the pandemic is 30,858 in 2015. In the latest year, 2023, the new method estimates 10,994 excess deaths in the UK, 20,448 fewer than the current method.”

    • What else can one say, other than “this seems rather convenient” (from the government's point of view, anyway).

  • “These increasing trends in population size and ageing, and the generally decreasing trend in mortality rates, are not accounted for by the current methodology for estimating excess deaths. However, they are reflected in the new methodology.”

    • This issue strikes one as something of a red herring, in terms of the question of excess deaths in the 2020 and beyond period compared to the five years before that. Though population growth and population aging generally will lead to more deaths, over these time-scales the effect would not be all that large. Furthermore, the population growth was almost exclusively due to migration, which is heavily concentrated in younger age groups, which won’t be expected to experience many deaths, relatively speaking.

A Note on the Graph

The graph below is from the Office of National Statistics methodology document. 
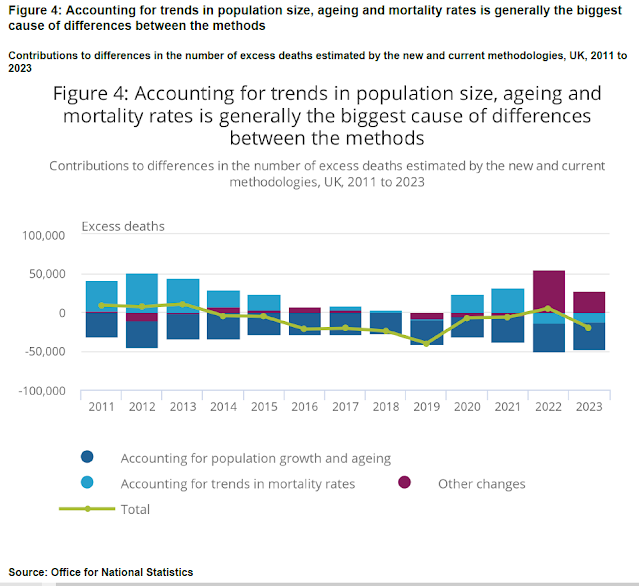
Note that in 2022 and 2023 the biggest cause of differences between the two models is simply given as “Other changes”. This is vague – a description like “Other changes” can hide a lot. After all, the “Other Changes” are precisely what most people are wondering about.

What are these "Other changes"?

  • Long term effects of Covid itself?

  • Long term effects of Covid measures such as lock-downs?

  • Long term effects of Covid vaccines?

The new model seems to be better at obscuring than revealing. Good sciences should be the other way around.

Saturday, 11 February 2023

Excess Deaths in Canada - (Alberta & B.C., 2020)

 Excess Deaths in Canada - (Alberta & B.C., 2020)

Many countries around the world (arguably in fact, most Western countries) have reported an unexpected and alarming number of excess deaths, when comparing counts of deaths in 2022 to the pre-Covid-19 totals. Excess deaths were expected during the height of the pandemic, but the SARS-2 virus had mutated to a milder form by late 2021, so it was expected that would have resulted in a significant drop total deaths, compared to 2020 and 2021.

Deaths should have fallen to pre-Covid levels; in fact there was the possibility that deaths would have been lower than pre-Covid. That’s because Covid-19 took a lot of people who were elderly and/or had other serious diseases, so that should have produced a “culling” effect, whereby some people died a year or two earlier than they might have otherwise. But that didn’t happen.

Canada has been slow to report deaths for 2022, so there is still no official word on how this has turned out for the Canadian population. However, the two most westerly provinces (British Columbia and Alberta), which account for about 25%-30% of the population have reported counts for deaths, up to early November 2022. So, I have used that data to explore the Canadian experience. There seems to be no good reason for the results for the country overall to be much different than the results for these two provinces.

The evidence, shown below, indicates that deaths did remain high, nearly as high in October-November 2022 as they were in the same period of 2021. Similarly to many other countries, the situation is most pronounced in the younger age groups and more-so among males than females.

Covid-19 Deaths in Alberta, October-November 2015-2022

To set the stage for the excess deaths analysis, a brief look at the Covid deaths will prove useful. Alberta data will be used for this, as it is quite complete and accessible.

The excess deaths data corresponds to the 5 week period between early October and early to mid November, for each of the years between 2015 and 2022. Therefore, we will look specifically at those periods, to see how the Covid pandemic was progressing in Alberta.

The period from 2015 to 2019 can be thought of as the normal, non-Covid period, as to the best of anyone’s knowledge, the pandemic didn’t begin until some time after November 2019. The years 2020 and 2021 were the height of the pandemic, while 2022 saw the virus mutate into a much less dangerous form.


 The data for Alberta demonstrates these trends in Covid-19. During 2020 this period saw steeply rising numbers of deaths per day (from about 2 to 10, 112 in all), while in 2021 deaths were high but falling (about 20 down to about 5, 330 in total), and in 2022 were mostly steady at about 5 per day (194 in total).

Admissions to the ICU in that province show similar trends; low but trending upward in Oct-Nov 2020, very high in Oct-Nov 2021 and relatively low in Oct-Nov 2022.

Overall Deaths in Alberta/B.C., October-November 2015-2022

Total Deaths (Covid-19 and All Others) are shown for the two provinces, in the table and graph below. In both cases, deaths increase noticeably after 2019, peaking in 2021, then falling somewhat in 2022.


This is somewhat at odds with the graphs for Covid Deaths and ICU admits in Alberta, in so far as the high death counts in 2022 don’t correspond very well with the relatively low Covid figures for that year. In other words, there appear to be excess deaths in the 2022, over and above what could be attributed to the Covid pandemic directly.

Looking at Alberta deaths separately (from the Alberta government Covid information website), we can determine how many Covid-19 deaths there were during these periods , and thus how many non-Covid deaths there were as well.

The graph and table shows that Covid-19 deaths did decline from 2021 to 2022, though non-Covid deaths actually increased somewhat during that period. But the main thing that the graph shows, is that non-Covid deaths are up substantially from the 2015-2019 totals (by about 400 deaths). Bear in mind that this data is just for the Oct-Nov 5 week period in each year; total deaths are likely to be 10 times that number.


It could be argued that some of the non-Covid deaths in the 2020-2022 period were simply a continuation of an increasing trend during the 2015-2019 period. To account for this, extrapolations from the 2015-2019 trend were done, as shown in the attached table and graph.

Two extrapolations are shown; a linear trend and a logarithmic trend. The latter has a higher R-Square and is more visually intuitive. Also, during this period both international and interprovincial migrations were severely curtailed due to Covid-related policies (e.g. lock-downs), so the continuation of a linear trend seems less likely than a logarithmic trend.


This then gives the following as an estimate of non-Covid excess deaths in Alberta during the Oct-Nov 5-week periods in the years 2020, 2021, and 2022.


If we then annualize those numbers, by multiplying by 10, we get about 3000 excess deaths for Alberta in 2022. Assuming that these assumptions could be generalized to all of Canada, that would mean about 30,000 deaths for the country in total.

In a future blog, a breakdown of age and gender excess deaths will be presented. As has been found in most jurisdictions around the world, the excess deaths phenomenon is most keenly felt in the younger age groups.


Sources and Related Blogs:

Statistics Canada: https://doi.org/10.25318/1310076801-eng

Alberta Covid Stats: https://www.alberta.ca/stats/covid-19-alberta-statistics.htm

https://ourworldindata.org/monkeypox

https://www.cebm.net/covid-19/excess-mortality-across-countries-in-2020/

https://www.worldometers.info/coronavirus/#countries

Some earlier Covid-19 blogs:

https://dodecahedronbooks.blogspot.com/2022/10/monkeypox-vs-covid-dna-vs-rna-first-168.html

https://dodecahedronbooks.blogspot.com/2022/05/covid-19-comparing-direct-case-measures.html

https://www.blogger.com/blog/post/edit/8998037621231280699/6639498264259397039

https://dodecahedronbooks.blogspot.com/2021/03/covid-19-vaccines-positive-results-from.html

https://dodecahedronbooks.blogspot.com/2021/03/covid-19-vaccines-how-successfully-are.html

https://dodecahedronbooks.blogspot.com/2020/12/covid-19-vaccines-comparison-of.html

https://dodecahedronbooks.blogspot.com/2020/09/covid-19-continues-to-travel-around.html

https://dodecahedronbooks.blogspot.com/2020/07/has-covid-19-become-less-deadly.html

https://dodecahedronbooks.blogspot.com/2020/07/july-2020-update-covid-19-death-rates.html

https://dodecahedronbooks.blogspot.com/2020/05/covid-19-death-rates-correlate-highly.html

https://dodecahedronbooks.blogspot.com/2020/06/covid-19-impact-on-employment-no-impact.html

https://dodecahedronbooks.blogspot.com/2020/04/is-there-model-that-can-predict-when-to.html

https://dodecahedronbooks.blogspot.com/2020/03/estimating-fatality-rate-of-coronavirus.html


=====================================================

And, here’s something that’s a bit more fun than excess deaths and worldwide virus pandemics.

A Drive Across Newfoundland

U.S.: https://www.amazon.com/dp/B07NMR9WM8

U.K.: https://www.amazon.co.uk/dp/B07NMR9WM8

Germany: https://www.amazon.de/dp/B07NMR9WM8

Japan: https://www.amazon.co.jp/dp/B07NMR9WM8

Canada: https://www.amazon.ca/dp/B07NMR9WM8

Australia: https://www.amazon.com.au/dp/B07NMR9WM8

India: https://www.amazon.in/dp/B07NMR9WM8

Newfoundland, Canada’s most easterly province, is a region that is both fascinating in its unique culture and amazing in its vistas of stark beauty. The weather is often wild, with coastal regions known for steep cliffs and crashing waves (though tranquil beaches exist too). The inland areas are primarily Precambrian shield, dominated by forests, rivers, rock formations, and abundant wildlife. The province also features some of the Earth’s most remarkable geology, notably The Tablelands, where the mantle rocks of the Earth’s interior have been exposed at the surface, permitting one to explore an almost alien landscape, an opportunity available on only a few scattered regions of the planet.

The city of St. John’s is one of Canada’s most unique urban areas, with a population that maintains many old traditions and cultural aspects of the British Isles. That’s true of the rest of the province, as well, where the people are friendly and inclined to chat amiably with visitors. Plus, they talk with amusing accents and party hard, so what’s not to like?

This account focusses on a two-week road trip in October 2007, from St. John’s in the southeast, to L’Anse aux Meadows in the far northwest, the only known Viking settlement in North America. It also features a day hike visit to The Tablelands, a remarkable and majestic geological feature. Even those who don’t normally consider themselves very interested in geology will find themselves awe-struck by these other-worldly landscapes.

A Ride on the Kettle Valley Rail Trail: A Biking Journal Kindle Edition

by Dale Olausen (Author), Helena Puumala (Editor)

The Kettle Valley Rail Trail is one of the longest and most scenic biking and hiking trails in Canada. It covers a good stretch of the south-central interior of British Columbia, about 600 kilometers of scenic countryside. British Columbia is one of the most beautiful areas of Canada, which is itself a beautiful country, ideal for those who appreciate natural splendour and achievable adventure in the great outdoors.

The trail passes through a great variety of geographical and geological regions, from mountains to valleys, along scenic lakes and rivers, to dry near-desert condition grasslands. It often features towering canyons, spanned by a combination of high trestle bridges and long tunnels, as it passes through wild, unpopulated country. At other times, it remains quite low, in populated valleys, alongside spectacular water features such as beautiful Lake Okanagan, an area that is home to hundreds of vineyards, as well as other civilized comforts.

The trail is a nice test of one’s physical fitness, as well as one’s wits and adaptability, as much of it does travel through true wilderness. The views are spectacular, the wildlife is plentiful and the people are friendly. What more could one ask for?

What follows is a journal of two summers of adventure, biking most of the trail in the late 1990s. It is about 33,000 words in length (2 to 3 hours reading), and contains numerous photographs of the trail. There are also sections containing a brief history of the trail, geology, flora and fauna, and associated information.

After reading this account, you should have a good sense of whether the trail is right for you. If you do decide to ride the trail, it will be an experience you will never forget.

Amazon U.S.: https://www.amazon.com/dp/B01GBG8JE0

Amazon U.K.: https://www.amazon.co.uk/dp/B01GBG8JE0

Amazon Germany: https://www.amazon.de/dp/B01GBG8JE0

Amazon Canada: https://www.amazon.ca/dp/B01GBG8JE0

Amazon Australia: https://www.amazon.com.au/dp/B01GBG8JE0

On the Road with Bronco Billy

Spring is on us now, and that brings on thoughts of ROAD TRIP. Sure, it is still a bit early, but you can still start making plans for your next road trip with help of “On the Road with Bronco Billy”. Sit back and go on a ten day trucking trip in a big rig, through western North America, from Alberta to Texas, and back again. Explore the countryside, learn some trucking lingo, and observe the shifting cultural norms across this great continent. Then, come spring, try it out for yourself.

Amazon U.S.: http://www.amazon.com/gp/product/B00X2IRHSK

Amazon U.K.: http://www.amazon.co.uk/gp/product/B00X2IRHSK

Amazon Germany: http://www.amazon.de/gp/product/B00X2IRHSK

Amazon Canada: http://www.amazon.ca/gp/product/B00X2IRHSK


Friday, 26 August 2022

Monkeypox vs Covid – The First 100 Days

 Monkeypox vs Covid – The First 100 Days

The Covid-19 pandemic is apparently over (but maybe not, time will tell), but now comes Monkeypox. So, an obvious question that comes to mind is, how does the beginning of the global Monkeypox outbreak compare to the start of the global Covid outbreak? To that end, this essay has mined some data from Our World in Data to make these comparisons, along with making some reasonable assumptions to put them into perspective.

Straight-up Comparison

The graph below is a straight-up comparison of the raw data, for the first 100 days, of the course of the two outbreaks. Looking at it this way, there is little similarity between the two; Covid-19 was a much more extreme outbreak than Monkeypox has been, at least so far.


Adjustment for Uncertainty in Start Dates

One problem with this comparison, is that it is difficult to say just when the two outbreaks began. The first day of the published data for the Covid-19 outbreak has 557 cases listed, which is obviously wrong. On the other hand, the published data for the Monkeypox outbreak begins with only 1 case for the first two days, then jumps to 11 by the third day. (The raw data is shown at the end of the blog).

So, the data has been adjusted, imputing some new adjusted data, by back-extrapolating the first few days, via the use of a smooth power law function that fits the data rather well, after this early “scanty-data” period. The graphs below show how this was done (i.e. used the equations to calculate the earlier predicted points).


With these adjusted start dates, the new Covid vs Monkeypox graph is shown below. This closes up the comparison between the Covid and Monkeypox outbreaks somewhat, though the Covid numbers are still much higher than the Monkeypox numbers.


Adjustment for At-Risk Populations

The most recent evidence shows that the two pandemics have effected very different populations. Covid-19 was quite widespread, hitting all age groups and genders, though Covid had a tendency for severe outcomes (hospitalizations and deaths) to increase with age and it was somewhat more severe for males than females. But, in terms of cases, the entire population of a given country tended to be hit fairly equally.

On the other hand, Monkeypox was almost entirely confined to a small section of the population, which has described as “men who have sex with men” (MSM). So, a more appropriate comparison of the two outbreaks might be made by simulating Covid-19 data, as it would apply to that smaller part of the population.

To do this, a few assumptions have to be made:

  • MSM are males.

  • MSM make up about 3 percent of the male population, or about 1.5% of the population in general.

  • MSM that are at risk of Monkeypox are mostly in the 20 to 59 age groups (presumably, the most sexually active group).

To adjust Covid-19 cases to simulate this sub-group, the numbers for the overall population were multiplied by 0.015, which produces the graph shown below.


This graph shows that once the differences in the at-risk populations are accounted for, the early stages of these outbreaks are rather similar. Making reasonable changes in the above assumptions will alter the graph to some extent, but this essential feature will remain true.

Another way to look at the situation is to simulate Monkeypox figures, as might be the case if the virus mutated into a form that spread through the air, in the manner of the corona virus that causes Covid-19. This can be done by dividing the Monkeypox data by 0.015, yielding the graph shown below.


 Although this graph has the same overall form of the previous one, it does emphasize that Monkeypox could have quite a Covid-like effect, if it was to evolve in this direction. Granted, that seems unlikely, as it is not an RNA-based virus, and thus should mutate at a much smaller rate than the SARS-2 Corona virus did.

Comparison of Deaths from Covid vs Monkeypox

So far, Monkeypox has had a very low fatality rate. As of the first 100 days, only about a dozen people were recorded as dying from Monkeypox, from a case count of over 35,000. So, that’s only about one per three thousand cases. Covid, on the other, had recorded about 240,000 fatalities by day 100. That’s a huge difference.

Or is it? Again, we have to account for the difference in at-risk populations:

  • There were about 3.25 million Covid cases by Day 100.

  • However, the MSM sub-group would only account for about 1.5% of these, or a bit under 41,000 cases.

  • But in this age range (20-59) the case fatality rate was very low, at about 1.2 per thousand in many industrialized counties, the set that has been hit hardest by Monkeypox.

  • So, that would imply about 49 fatalities in this particular sub-group of the population.

That’s about 4 times more fatalities than were seen in the Monkeypox group, implying that Covid-19 is probably more severe in its effects than Monkeypox, or at least it was in the early stages of the pandemic.

Nonetheless, it also implies that if Monkeypox were to become widespread in the overall population, the effects would be quite severe. Added to that, is the fact that Monkeypox has historically been much more severe in children than in other age groups.  So, a Monkeypox pandemic that included large numbers of children could be very tragic, indeed.

So, in summary, a widespread Monkeypox pandemic would be a bad thing, something that we definitely would want to avoid.


Source Data – From Our World in Data

Original Data

Start-Date Adjusted

Day

Covid-19

Monkeypox

Day

Covid-19

Monkeypox

1

557

1

1

1

1

2

657

1

2

4

2

3

944

11

3

14

3

4

1,437

11

4

37

5

5

2,120

11

5

82

8

6

2,929

11

6

160

13

7

5,580

12

7

284

18

8

6,169

13

8

557

26

9

8,237

13

9

657

36

10

9,927

17

10

944

41

11

12,038

17

11

1,437

60

12

16,787

20

12

2,120

105

13

19,887

41

13

2,929

121

14

23,899

60

14

5,580

121

15

27,644

105

15

6,169

194

16

30,806

121

16

8,237

230

17

34,400

121

17

9,927

274

18

37,131

194

18

12,038

362

19

40,162

230

19

16,787

414

20

42,771

274

20

19,887

431

21

44,814

362

21

23,899

451

22

45,232

414

22

27,644

574

23

60,384

431

23

30,806

639

24

66,912

451

24

34,400

723

25

69,055

574

25

37,131

848

26

71,238

639

26

40,162

942

27

73,273

723

27

42,771

950

28

75,155

848

28

44,814

1,057

29

75,655

942

29

45,232

1,172

30

76,216

950

30

60,384

1,322

31

76,846

1,057

31

66,912

1,419

32

78,608

1,172

32

69,055

1,565

33

78,990

1,322

33

71,238

1,608

34

79,558

1,419

34

73,273

1,617

35

80,412

1,565

35

75,155

1,731

36

81,384

1,608

36

75,655

1,791

37

82,728

1,617

37

76,216

2,035

38

84,152

1,731

38

76,846

2,182

39

86,023

1,791

39

78,608

2,558

40

88,402

2,035

40

78,990

2,752

41

90,382

2,182

41

79,558

2,757

42

92,994

2,558

42

80,412

2,764

43

95,316

2,752

43

81,384

3,058

44

98,027

2,757

44

82,728

3,340

45

101,957

2,764

45

84,152

3,514

46

106,088

3,058

46

86,023

4,072

47

109,942

3,340

47

88,402

4,276

48

114,265

3,514

48

90,382

4,288

49

119,051

4,072

49

92,994

4,484

50

126,527

4,276

50

95,316

4,871

51

133,283

4,288

51

98,027

5,219

52

146,477

4,484

52

101,957

5,372

53

157,365

4,871

53

106,088

6,179

54

168,598

5,219

54

109,942

6,448

55

183,165

5,372

55

114,265

6,492

56

198,339

6,179

56

119,051

6,532

57

215,899

6,448

57

126,527

7,026

58

242,986

6,492

58

133,283

7,473

59

272,516

6,532

59

146,477

7,705

60

304,943

7,026

60

157,365

8,395

61

339,156

7,473

61

168,598

9,455

62

381,711

7,705

62

183,165

9,577

63

423,596

8,395

63

198,339

9,604

64

475,075

9,455

64

215,899

10,195

65

535,890

9,577

65

242,986

11,067

66

599,820

9,604

66

272,516

11,485

67

669,402

10,195

67

304,943

12,096

68

725,918

11,067

68

339,156

12,984

69

790,929

11,485

69

381,711

13,000

70

869,371

12,096

70

423,596

13,038

71

951,084

12,984

71

475,075

13,855

72

1,033,528

13,000

72

535,890

15,049

73

1,117,697

13,038

73

599,820

15,623

74

1,177,956

13,855

74

669,402

16,263

75

1,250,135

15,049

75

725,918

16,983

76

1,324,652

15,623

76

790,929

16,987

77

1,393,480

16,263

77

869,371

17,021

78

1,475,476

16,983

78

951,084

18,307

79

1,562,248

16,987

79

1,033,528

19,842

80

1,648,773

17,021

80

1,117,697

20,995

81

1,724,228

18,307

81

1,177,956

21,836

82

1,843,259

19,842

82

1,250,135

23,056

83

1,914,995

20,995

83

1,324,652

23,141

84

1,999,444

21,836

84

1,393,480

23,273

85

2,077,235

23,056

85

1,475,476

24,490

86

2,171,659

23,141

86

1,562,248

25,932

87

2,259,490

23,273

87

1,648,773

26,585

88

2,337,722

24,490

88

1,724,228

27,708

89

2,414,435

25,932

89

1,843,259

28,875

90

2,490,358

26,585

90

1,914,995

28,989

91

2,566,573

27,708

91

1,999,444

29,129

92

2,648,525

28,875

92

2,077,235

31,116

93

2,731,129

28,989

93

2,171,659

32,549

94

2,815,167

29,129

94

2,259,490

33,700

95

2,898,660

31,116

95

2,337,722

34,388

96

2,969,529

32,549

96

2,414,435

35,797

97

3,040,471

33,700

97

2,490,358

35,940

98

3,116,272

34,388

98

2,566,573

36,060

99

3,193,642

35,797

99

2,648,525

37,534

100

3,277,493

35,940

100

2,731,129

38,853


Sources:

https://ourworldindata.org/monkeypox

https://www.cebm.net/covid-19/excess-mortality-across-countries-in-2020/

https://www.worldometers.info/coronavirus/#countries

Some earlier Covid-19 blogs:

https://dodecahedronbooks.blogspot.com/2021/03/covid-19-vaccines-positive-results-from.html

https://dodecahedronbooks.blogspot.com/2021/03/covid-19-vaccines-how-successfully-are.html

https://dodecahedronbooks.blogspot.com/2020/12/covid-19-vaccines-comparison-of.html

https://dodecahedronbooks.blogspot.com/2020/09/covid-19-continues-to-travel-around.html

https://dodecahedronbooks.blogspot.com/2020/07/has-covid-19-become-less-deadly.html

https://dodecahedronbooks.blogspot.com/2020/07/july-2020-update-covid-19-death-rates.html

https://dodecahedronbooks.blogspot.com/2020/05/covid-19-death-rates-correlate-highly.html

https://dodecahedronbooks.blogspot.com/2020/06/covid-19-impact-on-employment-no-impact.html

https://dodecahedronbooks.blogspot.com/2020/04/is-there-model-that-can-predict-when-to.html

https://dodecahedronbooks.blogspot.com/2020/03/estimating-fatality-rate-of-coronavirus.html

There are more Covid-related posts on the blog, that can be found from the labels coronavirus and Covid-19.

=====================================================

And, here’s a more pleasant travel story than anticipating the worldwide journey of a virus.

A Drive Across Newfoundland


U.S.: https://www.amazon.com/dp/B07NMR9WM8

U.K.: https://www.amazon.co.uk/dp/B07NMR9WM8

Germany: https://www.amazon.de/dp/B07NMR9WM8

Japan: https://www.amazon.co.jp/dp/B07NMR9WM8

Canada: https://www.amazon.ca/dp/B07NMR9WM8

Australia: https://www.amazon.com.au/dp/B07NMR9WM8

India: https://www.amazon.in/dp/B07NMR9WM8

Newfoundland, Canada’s most easterly province, is a region that is both fascinating in its unique culture and amazing in its vistas of stark beauty. The weather is often wild, with coastal regions known for steep cliffs and crashing waves (though tranquil beaches exist too). The inland areas are primarily Precambrian shield, dominated by forests, rivers, rock formations, and abundant wildlife. The province also features some of the Earth’s most remarkable geology, notably The Tablelands, where the mantle rocks of the Earth’s interior have been exposed at the surface, permitting one to explore an almost alien landscape, an opportunity available on only a few scattered regions of the planet.

The city of St. John’s is one of Canada’s most unique urban areas, with a population that maintains many old traditions and cultural aspects of the British Isles. That’s true of the rest of the province, as well, where the people are friendly and inclined to chat amiably with visitors. Plus, they talk with amusing accents and party hard, so what’s not to like?

This account focusses on a two-week road trip in October 2007, from St. John’s in the southeast, to L’Anse aux Meadows in the far northwest, the only known Viking settlement in North America. It also features a day hike visit to The Tablelands, a remarkable and majestic geological feature. Even those who don’t normally consider themselves very interested in geology will find themselves awe-struck by these other-worldly landscapes.

A Ride on the Kettle Valley Rail Trail: A Biking Journal Kindle Edition


by Dale Olausen (Author), Helena Puumala (Editor)

The Kettle Valley Rail Trail is one of the longest and most scenic biking and hiking trails in Canada. It covers a good stretch of the south-central interior of British Columbia, about 600 kilometers of scenic countryside. British Columbia is one of the most beautiful areas of Canada, which is itself a beautiful country, ideal for those who appreciate natural splendour and achievable adventure in the great outdoors.

The trail passes through a great variety of geographical and geological regions, from mountains to valleys, along scenic lakes and rivers, to dry near-desert condition grasslands. It often features towering canyons, spanned by a combination of high trestle bridges and long tunnels, as it passes through wild, unpopulated country. At other times, it remains quite low, in populated valleys, alongside spectacular water features such as beautiful Lake Okanagan, an area that is home to hundreds of vineyards, as well as other civilized comforts.

The trail is a nice test of one’s physical fitness, as well as one’s wits and adaptability, as much of it does travel through true wilderness. The views are spectacular, the wildlife is plentiful and the people are friendly. What more could one ask for?

What follows is a journal of two summers of adventure, biking most of the trail in the late 1990s. It is about 33,000 words in length (2 to 3 hours reading), and contains numerous photographs of the trail. There are also sections containing a brief history of the trail, geology, flora and fauna, and associated information.

After reading this account, you should have a good sense of whether the trail is right for you. If you do decide to ride the trail, it will be an experience you will never forget.

Amazon U.S.: https://www.amazon.com/dp/B01GBG8JE0

Amazon U.K.: https://www.amazon.co.uk/dp/B01GBG8JE0

Amazon Germany: https://www.amazon.de/dp/B01GBG8JE0

Amazon Canada: https://www.amazon.ca/dp/B01GBG8JE0

Amazon Australia: https://www.amazon.com.au/dp/B01GBG8JE0

On the Road with Bronco Billy


Spring is on us now, and that brings on thoughts of ROAD TRIP. Sure, it is still a bit early, but you can still start making plans for your next road trip with help of “On the Road with Bronco Billy”. Sit back and go on a ten day trucking trip in a big rig, through western North America, from Alberta to Texas, and back again. Explore the countryside, learn some trucking lingo, and observe the shifting cultural norms across this great continent. Then, come spring, try it out for yourself.


Amazon U.S.: http://www.amazon.com/gp/product/B00X2IRHSK

Amazon U.K.: http://www.amazon.co.uk/gp/product/B00X2IRHSK

Amazon Germany: http://www.amazon.de/gp/product/B00X2IRHSK

Amazon Canada: http://www.amazon.ca/gp/product/B00X2IRHSK