Friday, 29 July 2022

Globalization and the World-wide Progress of the Covid-19 Pandemic: Early-2020 to mid-2022

 Globalization and the World-wide Progress of the Covid-19 Pandemic: Early-2020 to mid-2022

Covid-19 is widely considered to be related to the recent trends in globalization. Basically, viruses can hitch a ride on people, and the things that they trade, to rapidly spread around the world. This seems entirely logical, though it is always good to examine the evidence, and see how our intuitions on these matters stand up to reality.

In order to look at this, I did some simple correlations and regressions between measures of globalization and measures of Covid-19 intensity, by country, during the duration of the pandemic, from early 2020 to mid-2022.

Globalization Measures

Globalization can mean many things to many people, so how can it be quantified and measured? It turns out that there is a lot of research on the subject and a number of globalization indices have been worked out. For this purpose I will use a series of measures created by the reputable KOF Swiss Economic Institute. Here is a brief explanation of these globalization measures, as stated on their website:

Economic globalization is composed of trade globalization and financial globalization, of which each gets a weight of 50 percent. Social globalization consists of personal contact, information flows and cultural proximity where each contributes one third. Economic, social and political globalization are aggregated to the Globalization Index using again equal weights. The overall KOF Globalization Index is calculated as the average of the de facto and the de jure Globalization Index.”

The graphs and correlation matrix below show how well these measures interact with each other, when calculated from a database of about 200 countries (each dot in the graphs corresponds to the globalization measures for a particular country). As you can see from the graphs, these measures appear to have quite a strong linear relationships (when a country is high on one variable, it is generally high on the other). The relationships between Overall Globalization, Social Globalization and Economic Globalization are especially strong, as seen by how the points tend to fall on a more or less straight lines for the relevant graphs. Political Globalization is not as strongly related, which would seem to indicate that it is measuring a somewhat different underlying phenomenon than the others.

Relationship Between Globalization Variables


In addition, they have quite high correlation coefficients. Note that a perfect positive correlation is equal to 1.00 and a perfect negative correlation is equal to -1.00, while a correlation of 0.00 indicates no linear relationship at all. Intermediate values indicate intermediate relationships.

The table of p-values indicate how likely this result would be, based on chance alone. Low p-values mean that the result is very unlikely to be a chance occurrence. P-values of less than 0.05 are conventionally considered “low enough” to provide strong evidence of a true relationship, with numbers lower than 0.01 indicating very strong evidence.

Globalization Indices Correlations


I should note that in the following analysis of the relationship between globalization and Covid-19, the globalization indices do not change over the time period of the data being analyzed. So, they measure globalization tendencies in countries at the start of the pandemic. That said, it is likely that these measures will be consistent over time, especially when comparing countries against each other – i.e. countries that were most globalization-friendly at the start will tend to remain that way, even as the pandemic sweeps the world, while countries that were not highly globalized are unlikely to choose to become so during a pandemic.

Covid-19 Measures

There are a number of possible measures that could be used to estimate the intensity of the pandemic at different points in time. Some examples:

  • Covid Infections per million population (cumulative or interval).

  • Covid Cases per million population (cumulative or interval).

  • Covid Deaths per million population (cumulative or interval).

  • Covid Case Fatality Rate (cumulative or interval).

All of these have strengths and weaknesses. A major weakness is the reliability and accuracy of information collections between different countries and over time within countries. I will tend to focus on Covid Deaths per million population, as that seems likely have the best record-keeping (dead bodies are hard to ignore).

The Relationship between Globalization Intensity and the Covid-19 Pandemic

Below are a selection of graphs at various points in time (about six months apart), showing the Overall Globalization Index (the scale of which varies between about 30 and about 100) versus Deaths per Million population. The upper left hand corner of the graphs gives the R-square between these two measures, which can be thought of as the proportion of variance in the scatter-plot between these variables that can be explained by a linear relationship. In other words, how well do the points follow a straight line.

May 2020

  • Early in the pandemic, most countries had rather low Deaths per Million Population, though a small number hit fairly high levels quite quickly.  Those tended to be the highly globalized countries, as measured by the Overall Globalization Index.

  • The R-square was quite low (0.0457), indicating that not much of the variance was explained by the linear relationship (also visually obvious).


November 2020

  • By autumn of 2020 the Deaths per Million Population had risen substantially in a lot of countries, though there were still many with very low death rates.

  • The R-square (0.112) had risen a fair bit, so the linear relationship was now accounting for much more of the variance. Nonetheless, there is still a lot of scatter in the graph.


June 2021

  • Deaths per Million Population had increased substantially (note the change in the scale of they y-axis from 0-1200, to 0-3000).

  • The R-square was also substantially higher (0.280), so much more of the variance is now being explained by the linear relationship.


November 2021

  • Deaths per Million Population continued to increase (note the change in the scale of they y-axis from 0-3000, to 0-6000).

  • There is now one very high outlier, at nearly 6000 Deaths per Million.

  • The R-square has dropped somewhat, to 0.206. This may be a seasonal effect, since at this point in time, one hemisphere will have experienced two winters, while the other has only experienced one winter. However, the differing mutational phases of the virus’s evolution may also have created this effect.


June 2022

  • Deaths per Million Population have continued to increase.

  • Several more countries have broken into the 4000 to 6000 Deaths per Million range.

  • The R-square has gone back up (0.265), and is now nearly the same as it was in June 2020 (0.280). This would tend to support the idea that there is a seasonal effect that is responsible for the up-and-down in the R-square values.


Time Trend of Correlation and R-Square, Globalization Indices vs Deaths per Million Population

Having looked at some individual point-in-time graphs of Overall Globalization vs Covid-19 Deaths per Million, we can now put these together on one graph, along with some other points-in-time. In addition, we can look at the relationship between the other globalization measures (Social, Economic, Political) and the Deaths per Million Population Measure.


  • Note that the lines for each of the globalization measures show similar trends.

  • For the top graph, correlation coefficients have been used, rather than R-square measures. Technically, the correlation coefficient (R) is just the square root of R-square (thus the name), so this just results in a scale effect, but the overall tendency of the graphs are similar.  The next graph gives the R-Square relationship between Globalization Measures and Covid-19 Deaths per Million Population.

  • The correlation (and R-Square) between globalization and deaths begins at a relatively low level, rises to a much highly level within a year (i.e. in four seasons), then drops a bit, and finally rises to about the same level at the end of two full years as it had been at the end of one year.
  • Social Globalization had the highest correlation with Deaths, followed by Economic Globalization, then finally Political Globalization at quite a bit lower level. The Overall Globalization measure (a combination of the three other measures) is not too far off the Social Globalization measure.

  • So, it seems that the movement of people (Social Globalization) had the most profound effect on the spread of the pandemic, followed the movement of things (Economic Globalization). Political Globalization was not so closely tied to the pandemic, perhaps because it is a more legalistic measure and thus had less of an organic relationship with the pandemic (viruses don’t travel on treaties).


There are some other interesting globalization aspects to the Covid-19 pandemic, which I will look at in a later blog.


Some earlier Covid-19 blogs:

https://dodecahedronbooks.blogspot.com/2021/07/covid-19-cases-and-deaths-by-continent.html

https://dodecahedronbooks.blogspot.com/2021/07/covid-19-cases-by-continent-jan-2000-to.html

https://dodecahedronbooks.blogspot.com/2021/03/covid-19-vaccines-how-successfully-are.html

https://dodecahedronbooks.blogspot.com/2020/12/covid-19-vaccines-comparison-of.html

https://dodecahedronbooks.blogspot.com/2020/09/covid-19-continues-to-travel-around.html

https://dodecahedronbooks.blogspot.com/2020/07/has-covid-19-become-less-deadly.html

https://dodecahedronbooks.blogspot.com/2020/07/july-2020-update-covid-19-death-rates.html

https://dodecahedronbooks.blogspot.com/2020/05/covid-19-death-rates-correlate-highly.html

https://dodecahedronbooks.blogspot.com/2020/06/covid-19-impact-on-employment-no-impact.html

https://dodecahedronbooks.blogspot.com/2020/04/is-there-model-that-can-predict-when-to.html

https://dodecahedronbooks.blogspot.com/2020/03/estimating-fatality-rate-of-coronavirus.html


 ===================================================
And, here’s a more pleasant travel story than anticipating the worldwide journey of a virus.

A Drive Across Newfoundland


U.S.: https://www.amazon.com/dp/B07NMR9WM8

U.K.: https://www.amazon.co.uk/dp/B07NMR9WM8

Germany: https://www.amazon.de/dp/B07NMR9WM8

Japan: https://www.amazon.co.jp/dp/B07NMR9WM8

Canada: https://www.amazon.ca/dp/B07NMR9WM8

Australia: https://www.amazon.com.au/dp/B07NMR9WM8

India: https://www.amazon.in/dp/B07NMR9WM8

Newfoundland, Canada’s most easterly province, is a region that is both fascinating in its unique culture and amazing in its vistas of stark beauty. The weather is often wild, with coastal regions known for steep cliffs and crashing waves (though tranquil beaches exist too). The inland areas are primarily Precambrian shield, dominated by forests, rivers, rock formations, and abundant wildlife. The province also features some of the Earth’s most remarkable geology, notably The Tablelands, where the mantle rocks of the Earth’s interior have been exposed at the surface, permitting one to explore an almost alien landscape, an opportunity available on only a few scattered regions of the planet.

The city of St. John’s is one of Canada’s most unique urban areas, with a population that maintains many old traditions and cultural aspects of the British Isles. That’s true of the rest of the province, as well, where the people are friendly and inclined to chat amiably with visitors. Plus, they talk with amusing accents and party hard, so what’s not to like?

This account focusses on a two-week road trip in October 2007, from St. John’s in the southeast, to L’Anse aux Meadows in the far northwest, the only known Viking settlement in North America. It also features a day hike visit to The Tablelands, a remarkable and majestic geological feature. Even those who don’t normally consider themselves very interested in geology will find themselves awe-struck by these other-worldly landscapes.


On the Road with Bronco Billy


Spring is on us now, and that brings on thoughts of
ROAD TRIP. Sure, it is still a bit early, but you can still start making plans for your next road trip with help of “On the Road with Bronco Billy”. Sit back and go on a ten day trucking trip in a big rig, through western North America, from Alberta to Texas, and back again. Explore the countryside, learn some trucking lingo, and observe the shifting cultural norms across this great continent. Then, come spring, try it out for yourself.


Amazon U.S.: http://www.amazon.com/gp/product/B00X2IRHSK

Amazon U.K.: http://www.amazon.co.uk/gp/product/B00X2IRHSK

Amazon Germany: http://www.amazon.de/gp/product/B00X2IRHSK

Amazon Canada: http://www.amazon.ca/gp/product/B00X2IRHSK


Tuesday, 5 July 2022

Mining Lithium from Spent Oil Wells – Imperial Oil Dives into the Briny Alberta Waters


Mining Lithium from Spent Oil Wells – Imperial Oil Dives into the Briny Alberta Waters

The Globe and Mail Report on Business had a story on June 24, 2022 outlining the investment of about 6 million dollars to join a pilot project for extracting lithium from a major oil formation, once prolific but now largely depleted. That would be the Leduc formation, which was the oil-rich geologic formation in central Alberta that kicked off the oil boom in that part of western Canada. It was discovered by Imperial Oil in 1947, so they have a lot of corporate knowledge of the geology of this formation in their archives. It is worth noting that Imperial Oil is Calgary based, but is nearly 70% owned by Exxon.

The hope is that the formation will have lithium rich brine that can be used in batteries and other items essential to electrification plans around the world (see the details of an earlier blog below, which explains the science behind lithium brines and old oil wells). The oil major is partnering with a company called E3 Lithium Ltd, which has plans to spend over $600 million on a lithium extraction project near Olds, Alberta (between Calgary and Edmonton). This area is known as the Clearwater region, but the Leduc Formation has a couple of other areas that have good prospects for lithium, called Rocky and Exshaw.

E3 Lithium claims to have developed some innovative technology to extract the lithium from the brine. They also say that they will incorporate renewable energy and carbon capture, to supply the energy needed for the lithium extraction process. They hope to produce 20,000 tons of lithium hydroxiide per year, beginning in 2026. They also have plans to refine that to battery-grade lithium.

As an example of lithium needs at a practical level, a Tesla auto battery uses about 60 kilograms of lithium. So, in principle, a year’s production from this plant could provide enough lithium for about 330,000 Tesla cars. So, there is probably plenty of scope for expansion.

P.S. I have no personal stake in this project, other than scientific curiosity.


Mining Lithium from Spent Oil Wells – A Talk by University of Alberta Geology Professor Daniel Allesi

Introduction

In order to get to net zero emissions (or even to approach that goal), a great deal of energy storage will be required. That’s especially true in areas like Canada, which have long periods with little sunlight, thus making solar power infeasible for much of the year, unless ample electrical storage is available. Lithium is one of the materials that is needed for electric storage, so lithium is a strategic resource of great importance, one that is currently not that widely accessible in most of the world.

This talk about extracting lithium from brines associated with spent oil wells in Alberta, Canada was delivered by Dr. Daniel Allesi of the Department of Earth and Atmospheric Sciences at the university of Alberta, a specialist in geochemistry and geomicrobiology. It dealt with his team’s research into the development of processes to extract lithium a commercial scale and prices competitive with current supplies. The official name of the talk was “Electric Potential; Extracting Lithium from Waste in Alberta”.

Lithium Demand


  • Huge growth in demand is expected for lithium, especially for use in Lithium-ion batteries. Lithium is basically used in all parts of these batteries, the anode, cathode and solution.

  • A 9X increase in demand is expected by 2030.

  • But supply is having trouble keeping up, so a shortage is expected soon, by about 2025.

  • Thus, many more sources of supply are needed, both conventional and unconventional.

  • One of those unconventional sources could be brine from the Duveney Formation, an oil-bearing rock formation in Alberta.

  • This brine is very salty, about 5X more than sea water (at about 136K ppm).

  • However it also does contain a fairly decent amount of Lithium, averaging at about 55 ppm.

  • Some cobalt, another strategic metal is also present, though at low concentrations.


Conventional Lithium Sources

  • Currently, one of the main conventional source of supply are salt flats, which contain Li2CO3.

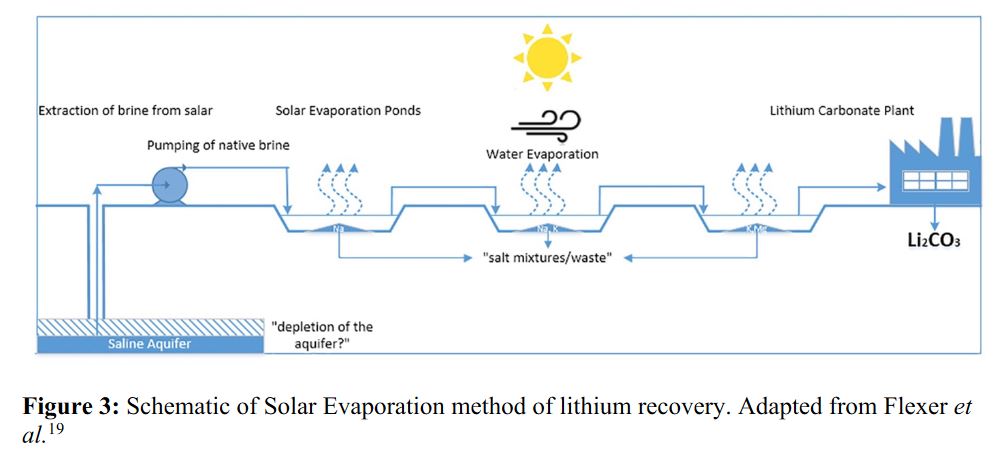
    • Solar evaporation is used to concentrate brine that has been collected in evaporation ponds. This results in a lithium precipitate, with a recovery rate of 50-60% of the lithium in the brine.

    • However, there are considerable environment impacts from this process. It uses a lot of water, in regions that are scarce in water. That water then becomes contaminated.

    • It also takes years to months for the necessary evaporation to occur and requires a lot of sunshine. These conditions are not that common (The dry high desert area of Chile is a current main source).

  • Hard rock, open pit mining (granite pegmatite) is another conventional source of supply. This can produce both Li2CO3 and LiOH. There are various such mines around the world, either working or in development (e.g. Africa, Australia, U.S., Quebec, there is a possibility of an Alberta mine as well).

Alberta Lithium Potential

  • Alberta has many millions of tons of Lithium Carbonate bran, in underground sources.

  • Though these are relatively low grade sources compared to a lot of current conventional supplies, they are abundant.

  • One estimate is 10 million tons at $25 thousand dollars per ton, so there is potentially lots of money to be made. Some brines have high grades, up to 140 ppm.

  • They tend to be found in areas that have had extensive oil and gas production. Therefore, costs can be reduced as much of the infrastructure needed already exists (i.e. from the oil/gas exploration and development).

  • Lithium in these brines is thought to be driven by hydro-thermal volcanic activity, deep underground.


Lithium Extraction Technology for Alberta Brine

  • There are many options for lithium extraction, such as the use of solvents, membranes, electrolysis or selective absorption.

  • The basic process can be thought of in these stages:

    • Drill and collect brine from underground source.

    • Use direct lithium extraction process (ion exchange) to remove lithium from the brine.

    • Re-inject the lithium-depleted brine back underground.

    • Do some cleanup, then precipitate solid lithium from the concentrate.

  • Some technical details (very simplified)

    • Metal beads (the sorbent) are used to adsorb lithium ions from the brine. These are manganese (III) and manganese (IV).

    • The metals are dipped into the brine.

    • Essentially, lithium ions are adsorbed by being selected into small regions in the metal’s crystalline structure. That is due to its small size (lithium is only the third element in the periodic table).

    • This loads the metal beads with lithium.

    • The metal beads (sorbent) are then rinsed in a solution to extract the lithium from the sorbent, resulting in a highly concentrated brine.

    • Solid lithium is then precipitated out in ponds.

    • The sorbent is then dried out for re-use, to start the cycle over again.

  • The process can be quick, on the scale of hours rather than months.

  • It can recover 80%+ of the lithium, though there are also some other products produced by the process.

  • Some technical/commercial issues to be worked out.

    • The big problem is the need to recycle and reuse the sorbent for the economics to be competitive (sorbent is expensive).

    • But, manganese is lost during the process, which is a problem as it is a key part of the sorbent.

    • Though the brine is from a “free site” (a site previously used for oil and thus has ready-built infrastructure) this creates a problem. The brine is often contaminated with hydrocarbons and other unwanted substances.

    • This coating of the sorbent with these oils may be part of the problem that leads to the loss of sorbent.

  • This is the professor’s major area of research (i.e. the need to be able to reuse the sorbent).

    • For commercialization, the sorbent loss rate must be kept low, perhaps only 1% or so for each cycle of the process.

    • Basically, there is a need to “clean up” the brine in order to save the sorbent. This is especially true for organics in the brine.

    • One idea is to centrifuge the brine, to separate out the contaminants before mixing with the sorbent.

    • Washing with a surfactant (soap, basically) may help also help in the quest to maintain and reuse the sorbent.

    • Use of chlorine, peroxide or filtration (ultra fine, nano-level) are some possible approaches. But filters are expensive.

    • Coating the sorbent with something like zirconium might help to protect the manganese from reduction, so less loss of useful sorbent.

  • H2S can also be a problem, by reducing Mn(IV) to Mn(III) or Mn(II), which are less useful sorbents. So that may need to be scrubbed.

Commercialization

  • Problems have been solved in the lab, but can the process be done at a commercial, industrial scale? Research on this is ongoing.

  • Using petrol-brine at a rate of 10K cubic meters per day, with a concentration of 80 ppm can yield 1500 tons of lithium per year.

  • At current prices, that is feasible, but prices are high right now, so the economics might not work at lower prices.

  • Economic incentives (e.g. tax breaks, subsidies) would be helpful (naturally).

  • One advantage in favour of the process, is that the money earned via this method could offset oil industry water storage costs, so complete cost recovery may not be necessary (though always preferable).

  • Another advantages is that a skilled workforce already exists in Alberta (oil/gas workers are already familiar with a lot of aspects of the overall process). Some incentives for re-training would also be useful.

  • Ultimately, the greatest benefit would come from producing batteries from the lithium, rather than exporting it for others to do.

    World Lithium Sources (excluding Alberta lithium brine in old oil wells)


Sources:

The talk “Electric Potential; Extracting Lithium from Waste in Alberta”. By University of Alberta Talk by Professor Daniel Allesi

Alberta Brine Map and diagram: Eccles, D.R.; Berhane, H. Geological introduction to lithium-rich formation water withemphasis on the Fox Creek area of west-central Alberta (NTS 83F and 83K); Energy Resources Conservation Board, Edmonton, AB, 2011; pp 1-17.

Lithium Recovery from Hydraulic Fracturing Flowback and
Produced Water using a Manganese-Based Sorbent (Masters thesis byAdam John Seip

Wiki 


========================================================== 

And here is a description of a (relatively) carbon-emission reduced adventure, which you can buy on Kindle (also carbon-emission reduced, compared to paper).

A Ride on the Kettle Valley Rail Trail: A Biking Journal Kindle Edition

by Dale Olausen (Author), Helena Puumala (Editor) 


The Kettle Valley Rail Trail is one of the longest and most scenic biking and hiking trails in Canada. It covers a good stretch of the south-central interior of British Columbia, about 600 kilometers of scenic countryside. British Columbia is one of the most beautiful areas of Canada, which is itself a beautiful country, ideal for those who appreciate natural splendour and achievable adventure in the great outdoors.

The trail passes through a great variety of geographical and geological regions, from mountains to valleys, along scenic lakes and rivers, to dry near-desert condition grasslands. It often features towering canyons, spanned by a combination of high trestle bridges and long tunnels, as it passes through wild, unpopulated country. At other times, it remains quite low, in populated valleys, alongside spectacular water features such as beautiful Lake Okanagan, an area that is home to hundreds of vineyards, as well as other civilized comforts.

The trail is a nice test of one’s physical fitness, as well as one’s wits and adaptability, as much of it does travel through true wilderness. The views are spectacular, the wildlife is plentiful and the people are friendly. What more could one ask for?

What follows is a journal of two summers of adventure, biking most of the trail in the late 1990s. It is about 33,000 words in length (2 to 3 hours reading), and contains numerous photographs of the trail. There are also sections containing a brief history of the trail, geology, flora and fauna, and associated information.

After reading this account, you should have a good sense of whether the trail is right for you. If you do decide to ride the trail, it will be an experience you will never forget.

Amazon U.S.: https://www.amazon.com/dp/B01GBG8JE0

Amazon U.K.: https://www.amazon.co.uk/dp/B01GBG8JE0

Amazon Germany: https://www.amazon.de/dp/B01GBG8JE0

Amazon Canada: https://www.amazon.ca/dp/B01GBG8JE0

Amazon Australia: https://www.amazon.com.au/dp/B01GBG8JE0

Tuesday, 14 June 2022

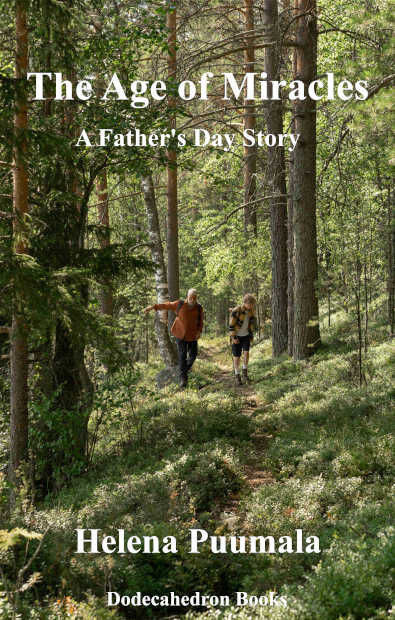
The Age of Miracles (A Father’s Day Story) – Inspirational Family Fiction, Free on Amazon June 16-20, 2022

 The Age of Miracles (A Father’s Day Story) – Inspirational Family Fiction, Free on Amazon June 16-20, 2022

It was my wife’s Father’s Day gift to me, so it seems only appropriate to share.


This short story (approx. 6
000 words) relates a trek along a lakefront path by a grandfather and his grandson. The simple lakeside walk becomes a journey of discovery, whereby they each learn much about the other, strengthening the bond between themselves in the process. When a crisis occurs, they, along with the boy’s father and the rest of the family and friends, learn something about the mysterious forces of the universe, about life and death, and about hope for the future.

The story is set in a Northern Ontario lake community, and continues to explore the setting and characters introduced in “The Boathouse Christ”, “Where the Apple Falls” and “A Christmas Miracle at the Lake”, also by Helena Puumala.


Amazon U.S.: https://www.amazon.com/dp/B09SCV6284

Amazon U.K.: http://www.amazon.co.uk/gp/product/B09SCV6284

Amazon Germany: http://www.amazon.de/gp/product/B09SCV6284

Amazon Canada: http://www.amazon.ca/gp/product/B09SCV6284

Monday, 13 June 2022

The Age of Miracles (A Father’s Day Story, by Helena Puumala) – Inspirational Family Fiction, now Available on Amazon

The Age of Miracles (A Father’s Day Story, by Helena Puumala) – Inspirational Family Fiction, now Available on Amazon


This short story (approx. 6000 words) relates a trek along a lakefront path by a grandfather and his grandson. The simple lakeside walk becomes a journey of discovery, whereby they each learn much about the other, strengthening the bond between themselves in the process. When a crisis occurs, they, along with the boy’s father and the rest of the family and friends, learn something about the mysterious forces of the universe, about life and death, and about hope for the future.

The story is set in a Northern Ontario lake community, and continues to explore the setting and characters introduced in “The Boathouse Christ”, “Where the Apple Falls” and “A Christmas Miracle at the Lake”, also by Helena Puumala.


Amazon U.S.: https://www.amazon.com/dp/B0B3WR2QPQ

Amazon U.K.: https://www.amazon.co.uk/dp/B0B3WR2QPQ

Amazon Germany: http://www.amazon.de/gp/product/B0B3WR2QPQ

Amazon Canada: https://www.amazon.ca/dp/B0B3WR2QPQ

Amazon Brazil: https://www.amazon.com.br/dp/B0B3WR2QPQ

Amazon India: https://www.amazon.in/dp/B0B3WR2QPQ

Amazon Australia: https://www.amazon.com.au/dp/B0B3WR2QPQ


Friday, 20 May 2022

Covid-19 – Comparing Direct Case Measures and Waste-water Estimates (Alberta Canada)

Covid-19 – Comparing Direct Case Measures and Waste-water Estimates (Alberta Canada)

It is now fairly common throughout the world to estimate the “true” level of Covid in a community from analysis of waste-water in municipal sewage systems. People infected with the virus that causes Covid-09 will shed some virus particles in their feces, which can be detected by instrumentation at regular intervals.

The trend in those measures will then give an indication of how many infections are actually active in the community. Not every person who is infected ever gets tested, but they will shed virus particles into the sewage system, so in principle this can be considered a superior method for tracking the true infection rate.

I used the data from Edmonton, Alberta to see how the trend in these two measures correlated. Note that though this data is from a particular locality, the general conclusions of the analysis would likely hold true in most other locations, as well.

 Below is a graph of Covid Cases in Edmonton during the October 2021 to May 2022 period, the times for which waste-water analysis is available on the Alberta government website. The left y-axis shows Edmonton region Covid cases (in yellow), while the right y-axis gives Covid Cases per Millilitre of waste-water in the combined Edmonton and Fort Saskatchewan waste-water treatment plants, the two plants that handle the bulk of the metro area’s waste-water.


As you can see, there is a good correlation for much of the period (the two lines almost overlay each other), though that relationship breaks down in the latter half of the period.

The waste-water measures are not taken every day, The data for direct case measures have some jitter as well (case counts are affected by the cycle of weekdays and weekends). Therefore, I constructed another graph with this data, using a seven-day moving average for both measures and lagging direct case measures by two days, relative to waste-water measures (it takes some time to actually get tested after symptoms begin). Two days was the amount of time that had the highest correlation between case counts and waste-water measures.


As noted, the nice visual correlations between the two lines in the line graphs break down at about the mid-January period of 2022. This effect is perhaps even better seen in the third graph, a scatter-plot of waste-water measure vs Covid case counts.


That graph shows that the relationship between the waste-water measures and the case counts is very similar for the Delta (blue, Oct21 to mid-Dec22) and Omicron.BA1 (red, mid-Dec21 to mid-Feb 22) periods, but much different for the Omicron.BA2 period (yellow, mid-Feb22 to May22). During that latter period, the slope of the regression line is much shallower than in the other two periods. In other words, any given measure of Covid copies per millilitre of waste-water corresponds to far fewer Covid cases during the Omicron.BA2 period that it did in the earlier phases.

The regression results are given below, or can be read directly off the graph. I used the “force y-intercept to 0” option, as it makes sense that when the waste-water results are at or near 0, the covid cases will also be at or near 0. For various reasons (e.g. lag times, measurement error, dis-interest in getting tested) that won’t be exactly true, but it should be reasonably close.

Waste-water (X) vs Covid (Y)

Forcing y-intercept to 0 beta coeff R2 Ratio(Delta)

Delta (Oct 21 – mid-Dec 21) 2.43 0.94 1.00

OmicronBA1 (mid-Dec 21 – mid-Feb 22) 2.18 0.91 0.90

OmicronBA2 (mid-Feb 22 – May 22) 0.71 0.96 0.29

These figures can be interpreted as:

  • Beta coefficient – gives the number of cases expected for each increase in the Covid copies per millilitre of waste-water.

  • R2 – shows how close the fit is to a straight line, with numbers closer to 1 indicating a better fit.

  • Ratio – shows how the other periods in question compare to the Delta variant period. So, for example, the Omicron.BA2 period had less than one-third as many cases for a given waste-water measure than did Delta.

It seems reasonable to assume that the Delta period gives the best measure of the relationship between the waste-water results and Covid counts and thereby Covid infections (though counts would have under-represented infections even then). That’s because Covid counts were relatively low during that period, so the medical system would not have been swamped by high demand for testing. In other words, a fairly high proportion of people with Covid symptoms would have likely gone on to be tested, and thus have been included in official case counts.

So, it seems that Covid numbers were probably becoming more and more seriously under-counted as the first wave of Omicron.BA1 progressed. This seems to have worsened during 2022, such that the Covid case count was likely very far off the true figures.

Why might that be? Here are some hypotheses:

  • The rapid sequence of Omicron.BA1 followed by Omicron.BA2 may have overwhelmed the testing system, resulting in a smaller proportion of infected people actually getting tested as time went on. Thus, the relationship between the waste-water measures and case counts became shallower.

  • With the growing sense within the population that Covid isn’t as pathogenic as it first was, many people might have decided not to bother with seeing a doctor or going to a clinic, as they felt they could just let the disease run its course.

  • The Alberta government had provided free home-testing kits fairly early in the first Omicron wave. As time went on, these kits were used up, and people decided not to bother with the home-testing if they had to purchase the kits themselves. Thus, testing declined.

  • Omicron.BA2 may have some odd effect, whereby infected people shed virus particles into the sewage system at a much higher rate than the other variants. While this may be true, it seems unlikely, as there has been no indication of that published, at least of which I am aware.

So, essentially, the waste-water results indicate that the number of Covid cases is probably now being vastly under-counted. One problem with that is that it may be giving the impression that Omicron.BA2 is more pathogenic than it really is. That’s because deaths will still be fairly reliably counted, while case counts become a less and less measure of actual infections.

I will see what the data says about that in a future blog.

=====================================================


And, here’s are some travel books to peruse, now that the reduction in Covid cases and severity has opened up travel again (fingers crossed).

A Drive Across Newfoundland


U.S.: https://www.amazon.com/dp/B07NMR9WM8

U.K.: https://www.amazon.co.uk/dp/B07NMR9WM8

Germany: https://www.amazon.de/dp/B07NMR9WM8

Japan: https://www.amazon.co.jp/dp/B07NMR9WM8

Canada: https://www.amazon.ca/dp/B07NMR9WM8

Australia:https://www.amazon.com.au/dp/B07NMR9WM8

India: https://www.amazon.in/dp/B07NMR9WM8

Newfoundland, Canada’s most easterly province, is a region that is both fascinating in its unique culture and amazing in its vistas of stark beauty. The weather is often wild, with coastal regions known for steep cliffs and crashing waves (though tranquil beaches exist too). The inland areas are primarily Precambrian shield, dominated by forests, rivers, rock formations, and abundant wildlife. The province also features some of the Earth’s most remarkable geology, notably The Tablelands, where the mantle rocks of the Earth’s interior have been exposed at the surface, permitting one to explore an almost alien landscape, an opportunity available on only a few scattered regions of the planet.

The city of St. John’s is one of Canada’s most unique urban areas, with a population that maintains many old traditions and cultural aspects of the British Isles. That’s true of the rest of the province, as well, where the people are friendly and inclined to chat amiably with visitors. Plus, they talk with amusing accents and party hard, so what’s not to like?

This account focusses on a two-week road trip in October 2007, from St. John’s in the southeast, to L’Anse aux Meadows in the far northwest, the only known Viking settlement in North America. It also features a day hike visit to The Tablelands, a remarkable and majestic geological feature. Even those who don’t normally consider themselves very interested in geology will find themselves awe-struck by these other-worldly landscapes.


A Ride on the Kettle Valley Rail Trail: A Biking Journal Kindle Edition

by Dale Olausen (Author), Helena Puumala (Editor)


The Kettle Valley Rail Trail is one of the longest and most scenic biking and hiking trails in Canada. It covers a good stretch of the south-central interior of British Columbia, about 600 kilometers of scenic countryside. British Columbia is one of the most beautiful areas of Canada, which is itself a beautiful country, ideal for those who appreciate natural splendour and achievable adventure in the great outdoors.

The trail passes through a great variety of geographical and geological regions, from mountains to valleys, along scenic lakes and rivers, to dry near-desert condition grasslands. It often features towering canyons, spanned by a combination of high trestle bridges and long tunnels, as it passes through wild, unpopulated country. At other times, it remains quite low, in populated valleys, alongside spectacular water features such as beautiful Lake Okanagan, an area that is home to hundreds of vineyards, as well as other civilized comforts.

The trail is a nice test of one’s physical fitness, as well as one’s wits and adaptability, as much of it does travel through true wilderness. The views are spectacular, the wildlife is plentiful and the people are friendly. What more could one ask for?

What follows is a journal of two summers of adventure, biking most of the trail in the late 1990s. It is about 33,000 words in length (2 to 3 hours reading), and contains numerous photographs of the trail. There are also sections containing a brief history of the trail, geology, flora and fauna, and associated information.

After reading this account, you should have a good sense of whether the trail is right for you. If you do decide to ride the trail, it will be an experience you will never forget.

Amazon U.S.: https://www.amazon.com/dp/B01GBG8JE0

Amazon U.K.: https://www.amazon.co.uk/dp/B01GBG8JE0

Amazon Germany: https://www.amazon.de/dp/B01GBG8JE0

Amazon Canada: https://www.amazon.ca/dp/B01GBG8JE0

Amazon Australia: https://www.amazon.com.au/dp/B01GBG8JE0


On the Road with Bronco Billy

Spring is on us now, and that brings on thoughts of ROAD TRIP. Sure, it is still a bit early, but you can still start making plans for your next road trip with help of “On the Road with Bronco Billy”. Sit back and go on a ten day trucking trip in a big rig, through western North America, from Alberta to Texas, and back again. Explore the countryside, learn some trucking lingo, and observe the shifting cultural norms across this great continent. Then, come spring, try it out for yourself.

Amazon U.S.:http://www.amazon.com/gp/product/B00X2IRHSK

Amazon U.K.: http://www.amazon.co.uk/gp/product/B00X2IRHSK

Amazon Germany: http://www.amazon.de/gp/product/B00X2IRHSK

Amazon Canada: http://www.amazon.ca/gp/product/B00X2IRHSK


Wednesday, 11 May 2022

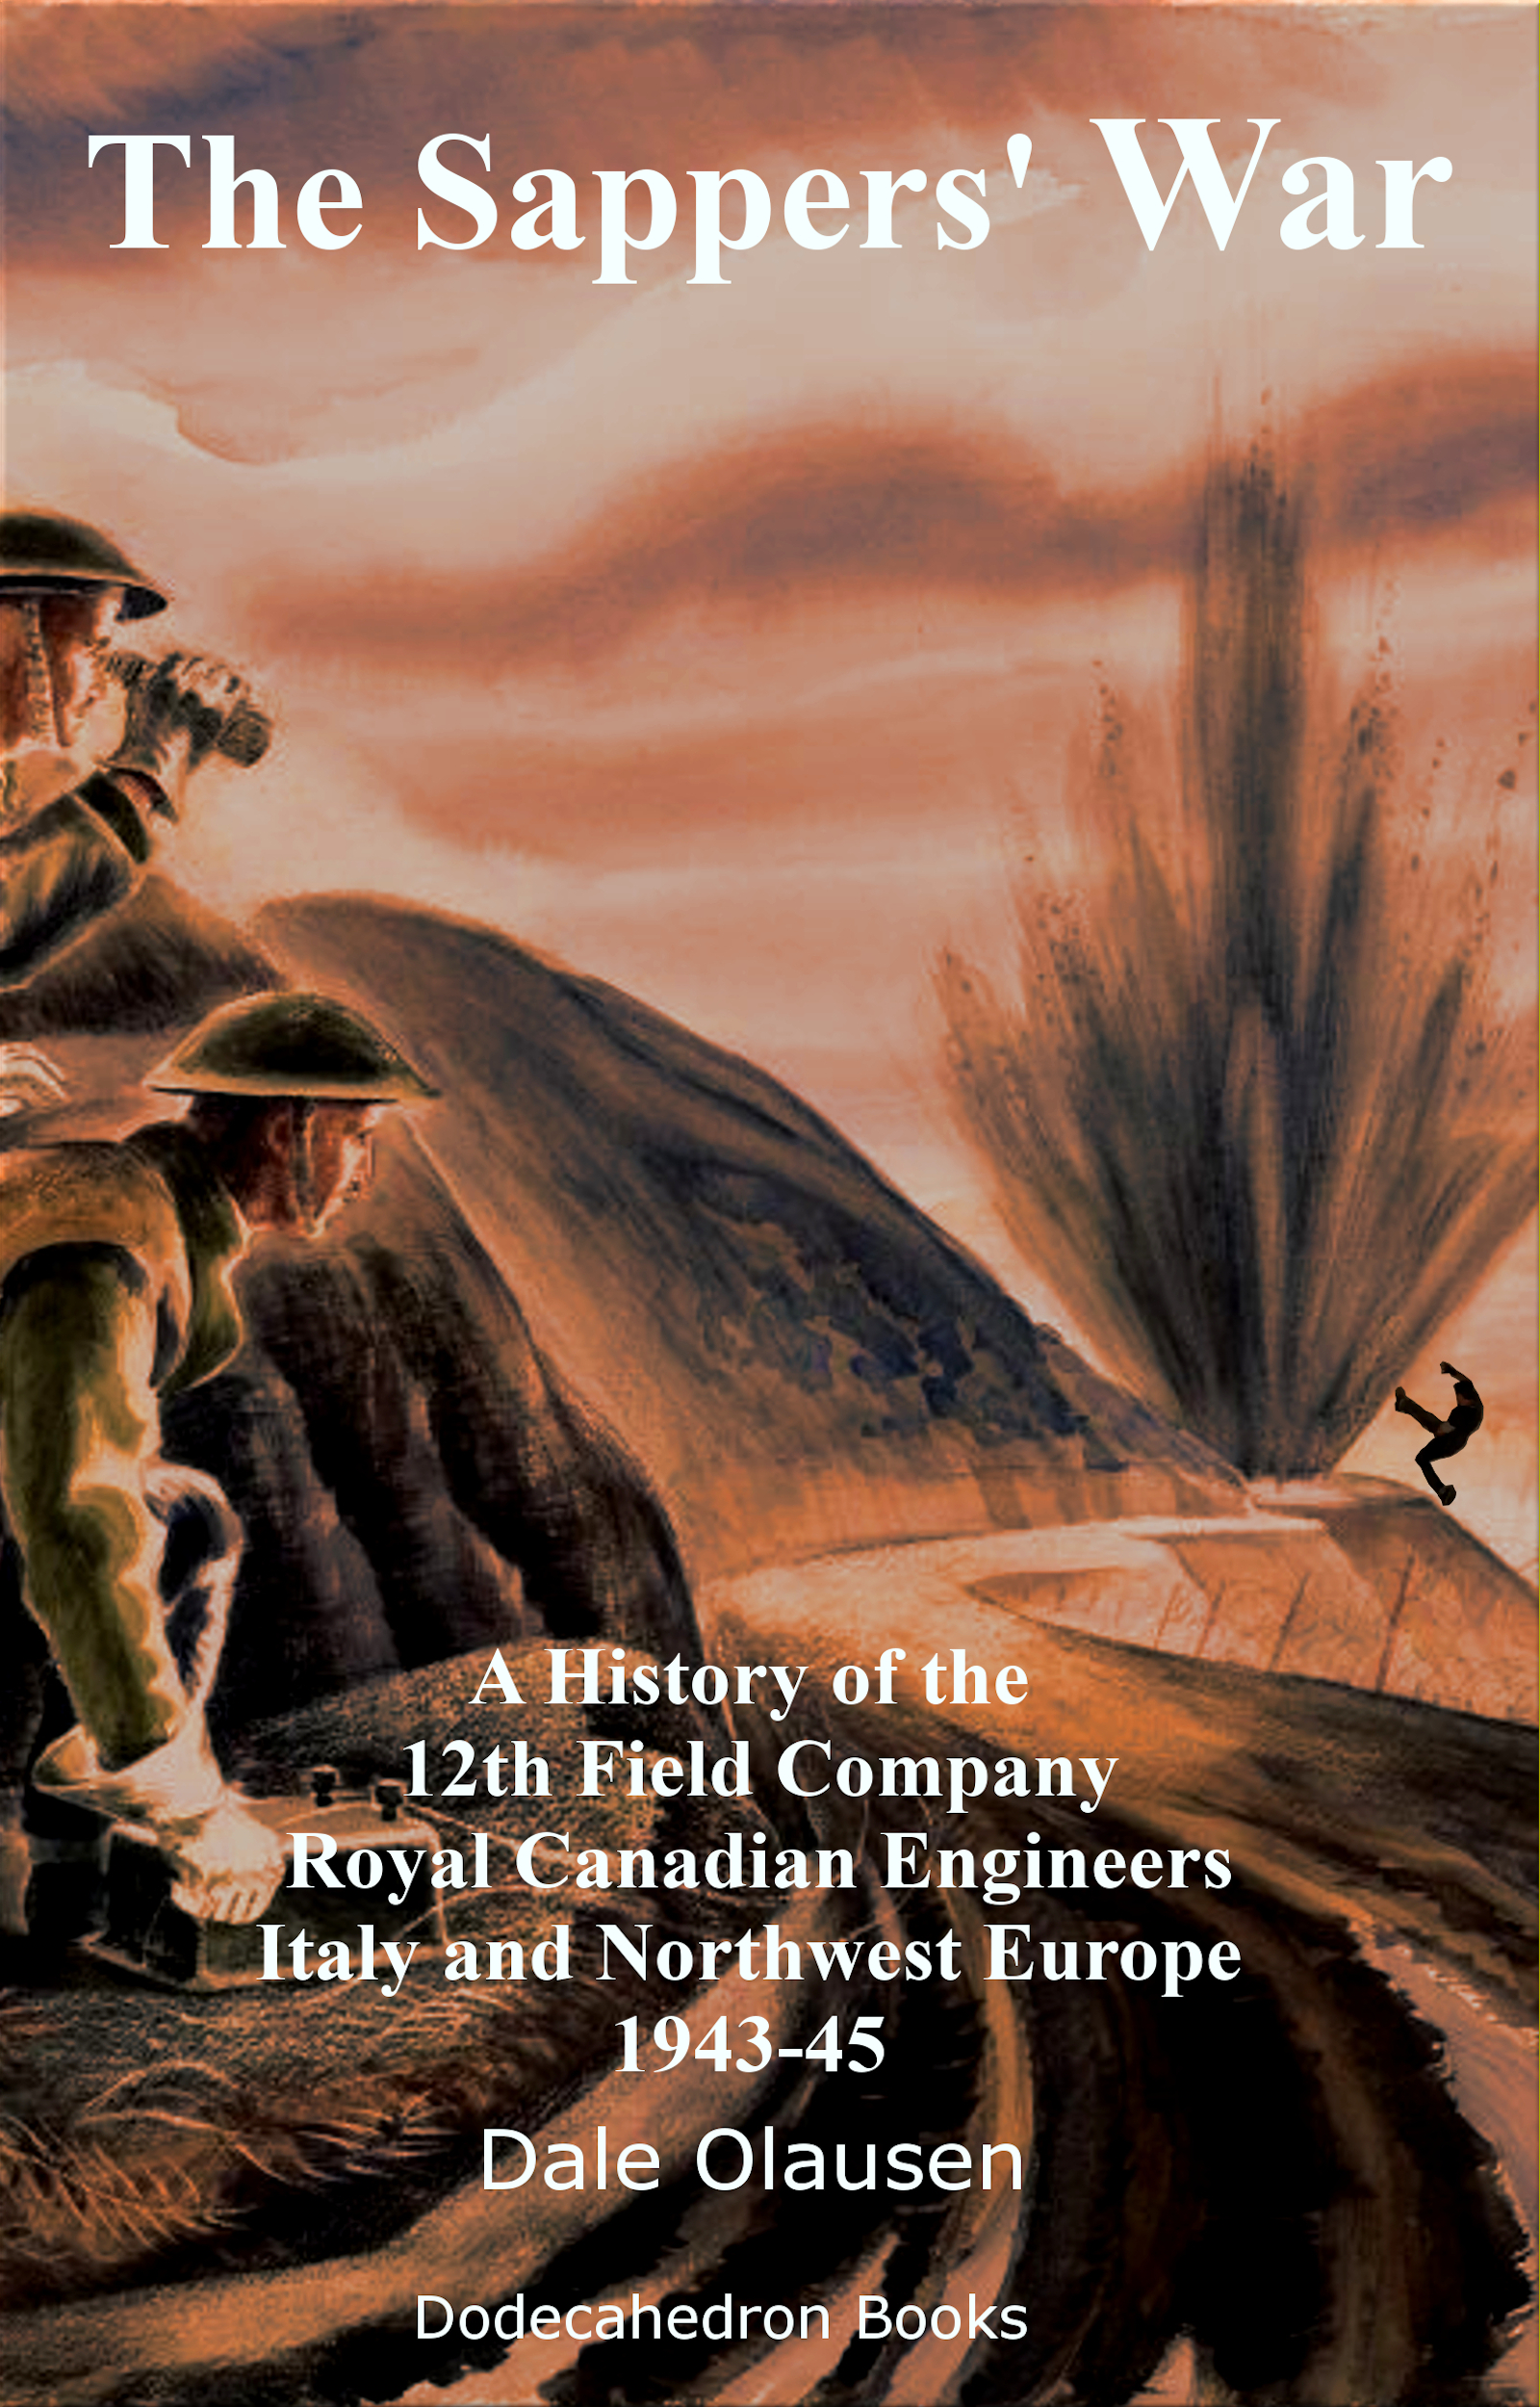
The Sappers' War: 12th Field Company Royal Canadian Engineers, Oct 1943 to Sept 1945, free on Amazon(May11-15)

 The Sappers' War: 12th Field Company Royal Canadian Engineers, Oct 1943 to Sept 1945, free on Amazon(May11-15, 2022)

Are you a history buff, particularly interested in World War 2? Or, did you have a family member or other relative participate in the conflict and are therefore curious about their experiences? If so, you might want to read about the journey of a military engineering company, throughout their time in action during the war.

The book focuses on one particular company of soldier/sappers in the Canadian Army, but many of their experiences would be common to any of the Allied units in the European theatre. Some of the major battles in which they were involved included Ortona, Monte Casino, the Gothic Line, the battles for Ravenna and the Po Valley, the Liberation of Holland and final defeat of the Third Reich.

In addition, some content relates to the experiences of civilians in Britain during that time. Appendices also look at some of the details of military engineering (e.g. bridging, mines, storm boats, the M-test), casualties, the Aldershot Riots and other issues of post-war rehabilitation and return to civilian life.

Much of the material comes from company war diaries and related materials, though a brief sketch of the wider campaigns relevant to the experience of these men is included, as are some interesting side-bars (e.g. the unit served alongside the celebrated irregulars known as Popski’s Private Army during their time in Northern Italy). To get a more “micro” feel for the on-site experiences of the time, some of my own family’s stories are related (a soldier/sapper, a war bride/war worker, a P.O.W., and an Atlantic convoy merchant marine sailor, among others). The summations of the War Diaries also include much interesting information about day-to-day life, both military and non-military.

So, grab your Lee-Enfield rifle and your mine-detector, and check out the life of a war-time sapper.


U.S.: https://www.amazon.com/dp/B09HSXN6Q2

U.K.: https://www.amazon.co.uk/dp/B09HSXN6Q2

Germany: https://www.amazon.de/dp/B09HSXN6Q2

France: https://www.amazon.fr/dp/B09HSXN6Q2

Spain: https://www.amazon.es/dp/B09HSXN6Q2

Italy: https://www.amazon.it/dp/B09HSXN6Q2

Netherlands: https://www.amazon.nl/dp/B09HSXN6Q2

Japan: https://www.amazon.co.jp/dp/B09HSXN6Q2

Brazil: https://www.amazon.com.br/dp/B09HSXN6Q2

Canada: https://www.amazon.ca/dp/B09HSXN6Q2

Mexico: https://www.amazon.com.mx/dp/B09HSXN6Q2

Australia: https://www.amazon.com.au/dp/B09HSXN6Q2

India: https://www.amazon.in/dp/B09HSXN6Q2

--------------------------------------------------------------------------------------------------------------

The Sappers' War: 12th Field Company Royal Canadian Engineers, Oct 1943 to Sept 1945

What follows is a review of the history of the 12th Field Company, Royal Canadian Engineers, primarily relating to the time that the company was in the Italian and Northwestern European theatres during World War II. Though the book focuses on the experiences of a particular company of Canadian military engineers, it also discusses some of the wider issues of the second world war and how it affected the people who lived through the era, civilian and military. Among those are my father (a sapper or military engineer) and mother (a war worker in wartime Britain and ultimately a war bride).

Thus, this is meant to be an informal and unofficial history of the company, written by an interested party in an effort to understand what these men went through during this period, and how that experience affected them and other people who lived through the war. The military aspects of the company's history are there (e.g. fighting, building bridges, detecting mines, maintaining routes), as are the cultural factors that influenced them and their times (e.g. the movies that they watched, the drinking they did, the many diseases they faced, their interactions with the Italian, British and other civilians that they lived among, their worries for the future). Some focus on life on the British home front is also given, via the experiences of my mother and her family.

Since many people had family and relations that lived during this time, it is my hope that the account will be of general interest to them, and to any that have a particular interest in this critical interval in history. Also, though the text relates specifically to Canadian sappers, I believe that many of the experiences will be common to the soldiers and loved ones of other nations who lived through the war, especially Americans and those from Britain and the British Commonwealth.

The primary sources of this document are the 12th Field Company War Diaries and related orders, with some material from The History of the Corps of Royal Canadian Engineers, Volume 2 as well as various official histories by the Department of National Defence. Various other published sources are used as well, especially when discussing the wider issues of the war or the army experience (e.g. Churchill’s history of the war) , or conversely when relating very specific episodes of the war (e.g. Popski’s Private Army in late 1944). Personal accounts of my father’s or mother’s stories also augment the narrative. I have tried to fit those in during appropriate time periods, though some stories are more general and have therefore don’t necessarily relate to the time period being discussed. Nonetheless, they do help capture the essence of “being there” during the war years.

The War Diary is a day by day account of the primary activities of a given unit, as recorded by personnel in the headquarters staff of that unit, and signed off by the commander of the unit. As such, it is an official record, though the writers often brought a bit of their own character into the document. Naturally, as a relatively brief document it can’t hope to capture the complexity of the individual stories of 280 or so men, so the family lore generally has no corresponding entry in the War Diary, though there are sometimes tantalizing hints and near-verifications of these personal accounts.

There are a number of other sources for the book, from official histories to popular history books. I include quotations and references from these works (an eclectic mix), as I believe that they also shed light on different aspects of this period of time, and besides that, are just interesting accounts, in and of themselves.