July 2020 Update: Covid-19 Death Rates Correlate Highly with a Country’s Level of Globalization
In an earlier blog, I had provided some evidence that the
Covid-19 pandemic really can be considered a “Disease of Globalization”. In that analysis, it was clear that there was
a high correlation, at the country level (some 175 countries were used in the
analysis), between deaths from Covid-19 and various measures of globalization
that had been calculated by the very reputable KOF Swiss Economic Institute. These included measures of Political,
Economic and Social Globalization, as well as an overall summative measure derived
from these sub-indexes.
Here is a brief explanation of these globalization measures,
as stated on the KOF website:
“Economic globalization is composed of trade globalization
and financial globalization, of which each gets a weight of 50 percent. Social globalization consists of personal contact, information flows and cultural
proximity where each contributes one third. Economic, social and political globalization are aggregated to the Globalization Index using again equal
weights. The overall KOF Globalization Index is calculated as the average of
the de facto and the de jure Globalization Index.”
The Covid-19 Deaths per Million Population figures were
taken from the reputable Worldometer website, which has been tracking the
pandemic closely since early 2020.
The correlations were exponential in nature, which indicated
that as globalization became greater, the death rate from Covid-19 increases
drastically, at a much greater than a linear rate. As I had stated in that blog:
“It is a bit like compound interest – two bank accounts may
grow at the same interest rate, but the bigger account will always have an
advantage, which grows over time. In
this case, though, it is a disadvantage rather than an advantage.”
That analysis was based on data on Covid-19 Deaths per
Million from the start of the pandemic (about Feb 2020 or so) until early May
(May 3, 2020). This update is for deaths
from early May (May 4, 2020) to early July (July 6, 2020. So, one might think of that as the early and
middle stages of the pandemic (or at least the first wave of the pandemic).
1) Covid-19 Death Rates and Social Globalization.
In the earlier analysis, it turned out that the relationship
between Covid-19 Deaths per Million Population and the Social Globalization
measure was highest, with an R-square of nearly 0.60. This is a measure of the association between
two variables, that can be though of as
the percentage of change in one variable that can be accounted for by the
change in the other variable (i.e. 60% of the variance in country Death Rates
(after a logarithmic transformation) is explainable by their level of Social
Globalization).
The graph below shows the new data and the old data, plotted
in separate colours and data point symbols (earlier Feb-May3 data is orange and
dots, while the later May4-July6 data is blue and triangles).
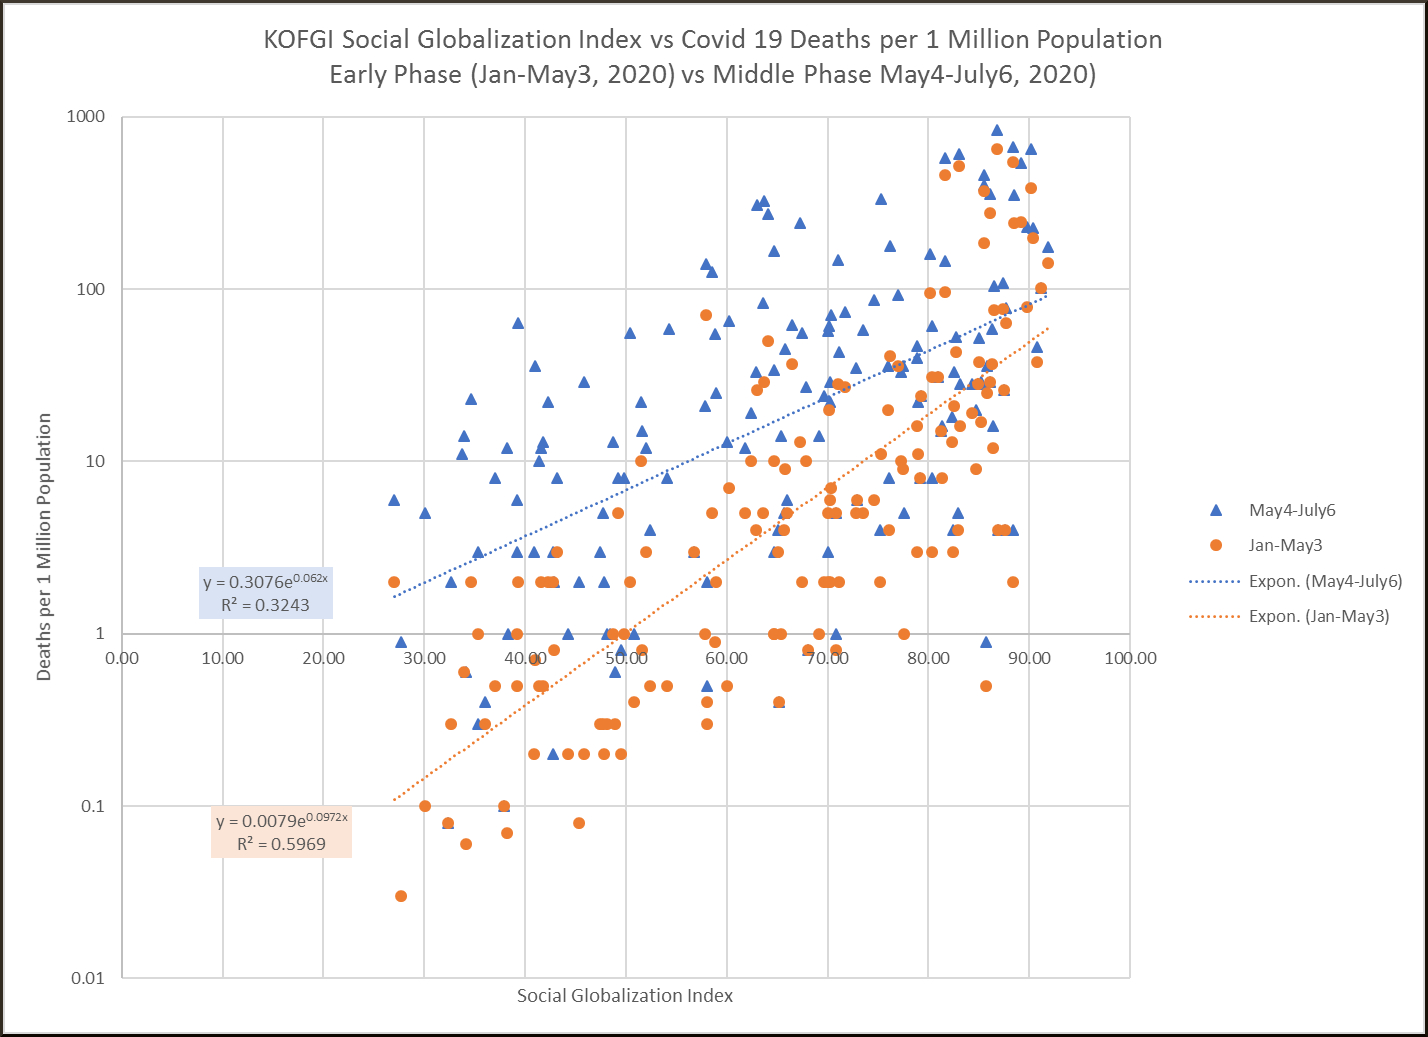
As you can see, there is still a fairly strong relationship
between Covid-19 Death Rates and Social Globalization, though it has attenuated
somewhat from the first analysis. Three
features of the data are:
- The points have tended to shift upwards, with the blue pints mostly being above the orange points. In other words, the Covid-19 Deaths per Million Population have risen overall, when looking at the world as a whole. It should be noted, however, that the Death Rate has come down in some countries.
- The strength of the functional relationship (a power law) has declined somewhat (the slope of the blue line is less steep than the orange line). This is also indicated by the magnitude of the exponent in the functional relationship (.097 vs .062).
- The strength of the correlation has declined, from about 0.60 in the earlier data to about 0.32 in the latest data. Though it isn’t easy to see this visually, that also means that the orange dots are closer to the orange line, on average, than the blue triangles are to the blue line.
2) Covid-19 Death Rates and Economic Globalization.
In the earlier analysis, the relationship between Covid-19
Deaths per Million Population and the Economic Globalization measure was second
highest, with an R-square of nearly 0.36.

As was the case with the Social Globalization measure:
- Death Rates have drifted upwards (that will of course be common to all of these sub-analyses).
- The strength of the power law is attenuated (exponent has gone from .077 to .049).
- The strength of the correlation is attenuated (R-square has gone from 0.36 to 0.18).
3) Covid-19 Death Rates and Political Globalization.
As in the earlier analysis, the relationship between
Covid-19 Death Rates and Political Globalization is weak.

Death Rates have trended higher, the power law is slightly
weaker and the R-square is down a bit.
4) Covid-19 Death Rates and Overall Globalization.
Lastly, here is the graph for Death Rates vs the Overall
Globalization Measure.

As would be expected, this graph is a mid-way result between
the other three:
·
Death Rates are up in general.
·
The slope of the line (exponent of the power
law) is down, from .098 to .066.
·
The R-square is lower, from 0.40 to 0.23.
Remarks
Below are some overall remarks and conclusions that can be
drawn from the updated data.
- It would appear that the formal political relationships between countries are not nearly as strong a driver of Covid-19 Death Rates as are the social relationships and the economic relationships. One might say that the virus prefers to travel on people, then goods, then abstractions like treaties.
- When looking at the set of countries as a whole, the relationship between Globalization and Covid-19 Death Rates is still relatively robust, though it has attenuated between the first part of the pandemic so far (Feb – May 3), and the second half (May 4 – July 7). This was seen for all of the Globalization measures.
- o One plausible explanation for this attenuation might be called “pandemic catch-up”. The countries that were first hit by the pandemic (those that were most highly plugged into the Globalization phenomena) have been able to take measures that have reduced the Death Rate or at least kept it from growing. Conversely, those that weren’t hit very hard early in the year have now entered the phase of the pandemic that the more globalized countries had entered earlier in the year.
- o So, the countries that were high on the graph earlier haven’t moved up by much, but many of those that were low on the graph have moved up. That is probably why the slope of the regression lines has gone down and why the R-square has fallen.
There are also some interesting geographical results that
show up in the data (relating to hemisphere and latitude) that I will explore
later. Below is an example:

There are, of course, cautions about any results of this
sort, especially those that relate to sensitive subjects such as a pandemic. Many people have doubts about the Covid-19
numbers from some countries, and they might also have doubts about the KOF
globalization numbers. That’s
natural. However, the fact that numbers
taken from two very different sources support the theoretical hypothesis of a
relationship between the disease spread and globalization is a pretty clear
indication that these numbers probably are reasonably reflective of the
underlying reality.
It could also be argued that countries that are low on
Globalization Measures are generally not very good at accurate data
reporting. That could be true in some
cases, but it is doubtful that it would invalidate these conclusions overall
(i.e. the relationships still seem to hold for countries in the mid to high
ranges of the various measures).
Sources:
KOF Swiss Economic Institute: https://kof.ethz.ch/en/forecasts-and-indicators/indicators/kof-globalisation-index.html
Worldometer Covid-19: https://www.worldometers.info/coronavirus/#countries
Some earlier Covid-19 blogs:
And, here’s a more pleasant travel story than anticipating
the worldwide journey of a virus.
A Drive Across Newfoundland
Germany: https://www.amazon.de/dp/B07NMR9WM8
Australia: https://www.amazon.com.au/dp/B07NMR9WM8

Newfoundland, Canada’s most easterly province, is a region
that is both fascinating in its unique culture and amazing in its vistas of
stark beauty. The weather is often wild, with coastal regions known for steep
cliffs and crashing waves (though tranquil beaches exist too). The inland areas
are primarily Precambrian shield, dominated by forests, rivers, rock
formations, and abundant wildlife. The province also features some of the
Earth’s most remarkable geology, notably The Tablelands, where the mantle rocks
of the Earth’s interior have been exposed at the surface, permitting one to
explore an almost alien landscape, an opportunity available on only a few
scattered regions of the planet.
The city of St. John’s is one of Canada’s most unique urban
areas, with a population that maintains many old traditions and cultural
aspects of the British Isles. That’s true of the rest of the province, as well,
where the people are friendly and inclined to chat amiably with visitors. Plus,
they talk with amusing accents and party hard, so what’s not to like?
This account focusses on a two-week road trip in October 2007, from St. John’s in the southeast, to L’Anse aux Meadows in the far northwest, the only known Viking settlement in North America. It also features a day hike visit to The Tablelands, a remarkable and majestic geological feature. Even those who don’t normally consider themselves very interested in geology will find themselves awe-struck by these other-worldly landscapes.
This account focusses on a two-week road trip in October 2007, from St. John’s in the southeast, to L’Anse aux Meadows in the far northwest, the only known Viking settlement in North America. It also features a day hike visit to The Tablelands, a remarkable and majestic geological feature. Even those who don’t normally consider themselves very interested in geology will find themselves awe-struck by these other-worldly landscapes.
On the Road with Bronco Billy
Spring is on us now, and that brings on thoughts of ROAD TRIP. Sure, it is still a bit early, but you can
still start making plans for your next road trip with help of “On the Road with
Bronco Billy”. Sit back and go on a ten
day trucking trip in a big rig, through western North America, from Alberta to
Texas, and back again. Explore the
countryside, learn some trucking lingo, and observe the shifting cultural norms
across this great continent. Then, come
spring, try it out for yourself.

Amazon U.K.: http://www.amazon.co.uk/gp/product/B00X2IRHSK
Amazon Germany: http://www.amazon.de/gp/product/B00X2IRHSK
Amazon Canada: http://www.amazon.ca/gp/product/B00X2IRHSK
No comments:
Post a Comment