Covid-19 - (4) A
World-Wide Test of the Mask Law Hypothesis - Detailed Statistics 4, Qatar to Zimbabwe
Introduction:
(note that if you have
previously read the introduction to Part 1, this is essentially the same text,
so you can skip right to the graphs and results)
The use of masks and mask-laws to prevent Covid-19
infections is obviously a huge, multi-faceted, complex and controversial
subject. There are a lot of lines of evidence, sometimes contradictory, ranging
from detailed medical studies (e.g. hospital ICU studies), to engineering
studies (e.g. viral aerosol particle hang-time indoors), to ecological
studies (how did mask-laws seem to affect infection rates in various
situation).
So, intrepidly and perhaps foolishly, I thought I would add
to the discussion via looking at how mask-laws seemed to have actually worked
around the world, on a national level. I used publicly available data
sources (as outlined below) and relied on primarily graphical evidence,
supplemented by simple curve-fitting, to examine and judge the evidence as
objectively as I possibly could. I also state the methods that I used and the
overall hypothesis that the data will be used to test.
The evidence and my judgments are shown below, and in three
more blogs, on a case-by-case basis. I broke the data in to 4 blogs, as
there are some 123 countries that had mask-laws in the data, and I didn't want
to overwhelm the reader with that much data all at once.
An accompanying blog will give my analysis of the overall
conclusions, taking into account the evidence of the 123 countries as a
whole. However, by presenting the evidence in this way, it is my
intention that anyone (statistician or interested layperson) can look at the
data and draw their own conclusions.
As for my own qualifications, I am a statistician (or data
scientist, a popular new term) who does operational research for a large
Canadian university. Covid-19 isn't my area of expertise but data
analysis of this sort (practical observational studies of the effect of
targeted interventions on a population) is a fairly broad area, one with which
I am familiar. But, as I say, interested readers should scan through the graphs
and narratives and form their own conclusions.
Statement of Hypothesis and Description of Method of Evaluation
For my purposes the Mask-Law Hypothesis can be stated as:
"A national mask-law will result in the number of new Covid-19 cases
coming down within the one month period after the mask-law date, relative to
the trend in the one month period before that date". It has often
expressed in more informal terms as "a mask-law will help bend the curve
downwards".
Since observational studies of this sort have many potential
confounders, the hypothesis can be restated in a form that attempts to control
for these confounders, by analyzing a large number of cases, on the assumption
that the effects of these confounding variables will tend to cancel out as the
number of cases increases. The restated form of the hypothesis is then: "National
mask-laws will result in new Covid-19 cases coming down within the one month
period after the mask-law date, relative to the trend in the one month period
before that date, in the vast majority of countries in which the mask-law is
implemented".
Below are the detailed, country-by-country statistics for
Covid-19 cases by days before and after that particular country's mask-law, as
indicated on the source Masks4All website (which provided the mask-law date)
and the GitHub repository of Covid-19 statistics (which provided the aggregate
number of cases during the study period, by day).
The graphs show:
- Line
graphs of aggregate case counts in the 4 week periods before and after the
law, to obtain an overall sense of how the numbers evolved during the
study period. Linear and quadratic functions are fit to the data, to
give a visual and mathematical basis for determining whether the general
trend was up, flat or down in that country during the 8 week period.
- Line
graphs with forecasts of cases for the four weeks after the mask-law,
based on the trend during the four weeks before the law, along with the
actual results during that succeeding four weeks. This enables a
comparison of forecasts and actuals, to determine whether or not the
pre-law trend in cases appeared to be affected by the mask-law.
Generally speaking, the two best fitting functions of the linear,
quadratic, exponential and logarithmic cases are shown (determined by
R-square, a conventional measure of model fitness, where the best forms
have R-square closest to 1.00).
- A bar
graph with the number of new cases each week during that time, as well as
the functional form that best fits that data. This gives a visual
and mathematical picture of how new cases varied on a weekly basis.
I use this
data to judge how well the evidence supports the mask-law's apparent
effectiveness for each country. Readers may sometimes dispute my opinion,
though I think the majority of cases are not too difficult to categorize.
However, although the evidence for or against the mask-law hypothesis is
sometimes quite clear-cut, at other times it is only somewhat persuasive and
sometimes it is too inconclusive to render any sort of judgment.
The upper left hand corner graphs, giving the functional
forms (visually and mathematically) for the aggregate data are measures of how
well the mask-laws seem to be doing in their expected roles (i.e. bending the
curve downwards).
- Concave
Down -The second order polynomial fit to the data (the yellow line)
tends to bend downwards. This is generally supportive of the mask-laws
(positive evidence), though in some cases this could just be the
continuation of a trend that began before the law was passed.
- Linear
- The second order polynomial and the linear function nearly overlie each
other, indicating that the number of new cases was essentially steady
during the period. This would not be supportive of the
mask-law's effectiveness (neutral evidence), though it could be argued
that the mask-law prevented an exponential increase.
- Concave
Up - The second order polynomial fit to the data (the yellow line)
tends to bend upwards. This is generally not supportive of the
mask-laws (negative evidence). Indeed, it could be argued
that in these cases the mask-law not only didn't work, but actually
contributed to making the situation worse (perhaps by creating a false
sense of security).
The upper right hand corner graphs show the forecast of cases, based on the
four weeks of data before the mask-law date. As noted, some alternative
trend lines are given, those which best fit the pre-law data (based on their
R-square, a statistical measure of goodness-of-fit).
I should note that forecasts of this sort, based on limited data, can be
misleading, so you have to use your common sense as well as the statistical
R-square measure, when deciding whether they are appropriate. For
example, exponential functions don't generally apply over a very long range of
data in the real world (resources eventually run out), so care has to be taken
when utilizing them. Also, a quadratic function can predict a decline in
aggregate cases, which is physically impossible, so care must be taken to not
rely on this form in these instances.
The actual case counts during the four weeks after the mask-law are also
shown. Again, there are three main possibilities:
- Actuals
Below the Trend - If the number of cases are below the forecasts, that
indicates that the mask-law appears to have slowed or reversed the
trend. This is generally supportive of the mask law's
effectiveness (positive evidence for the mask-law hypothesis).
- Actuals
Mirror Trend - If the number of cases are very close to the forecast,
that indicates that the mask-law had no observable effect on the
trend. This would not be supportive of the mask- law's
effectiveness, but wouldn't indicate that the mask-law was
counter-productive (neutral evidence as regards the mask-law hypothesis).
- Actuals
Above the Trend - If the number of cases exceeds the forecasts, that
indicates that cases grew faster than the pre-existing trend and that the
the mask-law did not slow the trend, it may have even sped it up. This
is generally not supportive of the mask-law's effectiveness (negative
evidence against the mask-law hypothesis).
The lower
left hand bar graphs give the number of new cases, on a week-by-week basis,
before and after the mask-law. It also has as best-fit function for the
new cases data, to aid the visual interpretation. There are three main
ideal-type cases, as well as many intermediate possibilities:
- The
graph has a hump-like shape, with new cases rising before the mask-law
date, peaking shortly after the mask-law, then falling. This
is generally supportive of the mask-law's effectiveness (positive evidence
for the mask-law hypothesis).
- The
graph is more or less flat, with no strong pattern of growth or shrinkage
over the course of the eight week period. This would not be
supportive of the mask-law's effectiveness, but wouldn't indicate that the
mask-law was counter-productive (neutral evidence as regards the mask-law
hypothesis).
- The
graph shows steady, often exponential, growth after the mask-law date,
compared to before that date. This is generally not supportive
of the mask-law's effectiveness (negative evidence against the mask-law
hypothesis).
The three
lines of evidence are then considered and an overall evaluation is given, via a
five-level categorization. The categories are given below:
- Category
2: Strong positive evidence. The aggregate case graph is
generally downward, actual cases are below the pre-law forecasts and new
cases clearly fall after the mask-law date.
- Category
1: Weak positive evidence. The majority of the lines of evidence
favour the mask-law, but the evidence is relatively weak and/or has some
contrary indications.
- Category
0: Neutral evidence. None of the lines of evidence show very
persuasive evidence, one way or the other.
- Category
-1: Weak negative evidence. The majority of the lines of
evidence do not favour the mask-law, but the evidence is relatively weak
and/or has some contrary indications.
- Category
-2: Strong negative evidence. The aggregate case graph is
generally upward, actual cases are above the pre-law forecasts and new
cases clearly rise (often exponentially) after the mask-law date.
Since there are 123
countries in the study, I will have to break the data into several blogs,
just to avoid overloading blogger with graphs. This is Part 4, with
countries from Qatar to Zimbabwe (alphabetically ordered). Note that
not all countries passed mandatory mask laws and therefore not all countries
could be included in this study.
Part 1, with countries from
Algeria to Cuba is in the link below:
https://dodecahedronbooks.blogspot.com/2021/09/covid-19-1-world-wide-test-of-mask-law.html
Part
2, with countries from
Czechia to Kazakhstanis in the link below:
https://dodecahedronbooks.blogspot.com/2021/09/covid-19-2-world-wide-test-of-mask-law.html
Part
3, with countries from
Kenya to Portugal is in the link below:
https://dodecahedronbooks.blogspot.com/2021/09/covid-19-3-world-wide-test-of-mask-law.html
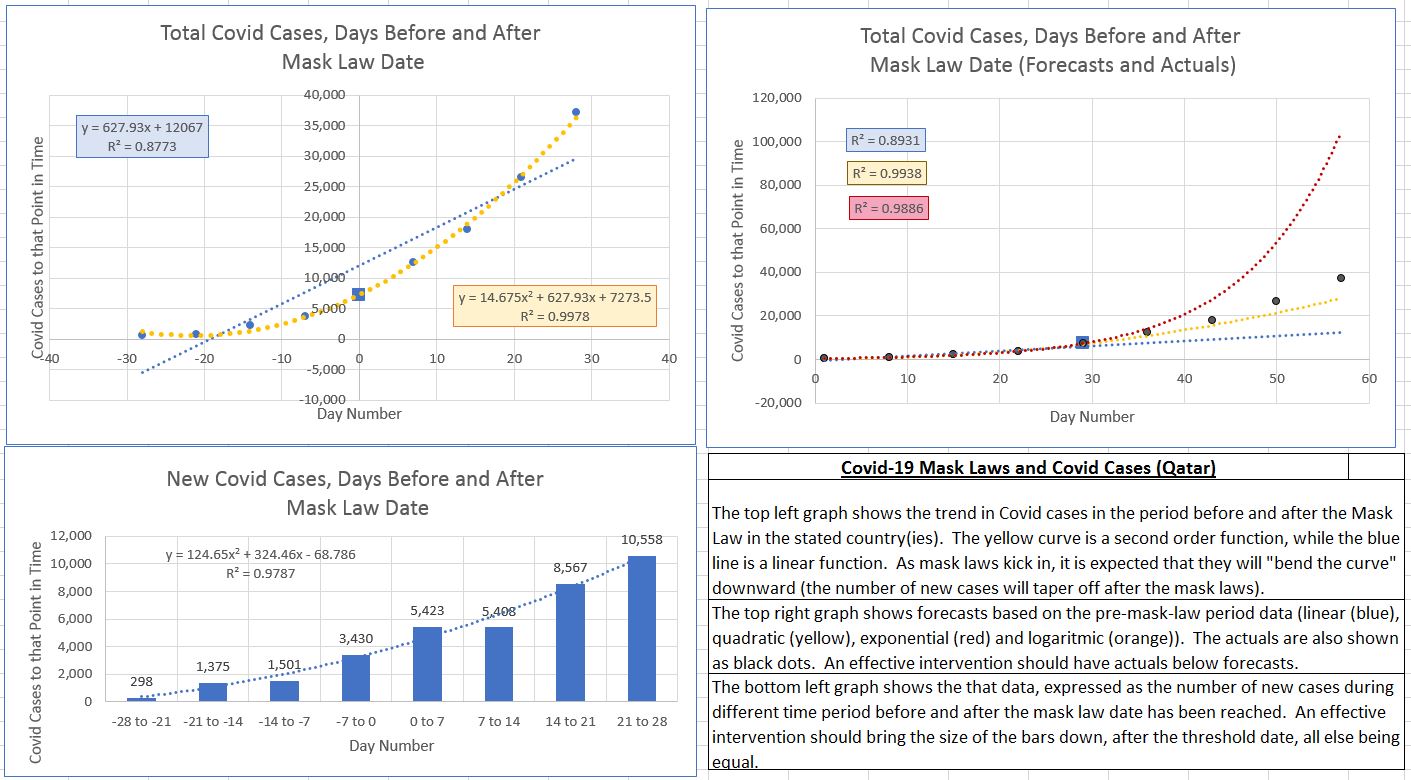
Qatar
Aggregate Cases Mask Law Date: 22/04/2020
Functional Form: Concave Up
Forecasts vs Actuals: Actuals higher than best-fit forecasts.
New Cases Bar Graph: New cases higher after mask-law date than before.
Categorization: -2 (Strong Negative Evidence)
Comment: The yellow quadratic function is concave up and the blue bar graph of new cases shows a strong upward trend over the entire study period. Post-law actuals are higher than the best-fit pre-law forecast (note that the yellow quadratic is a better fit than the red exponential). Thus, this is considered strong negative evidence against the mask law hypothesis.
Roumania
Mask Law Date: 15/05/2020
Aggregate Cases Functional Form: Concave Down
Forecasts vs Actuals: Actuals mirror the best-fit forecasts.
New Cases Bar Graph: New cases lower after mask-law date than before.
Categorization: 0 (Neutral Evidence)
Comment: The quadratic curve is concave down and the new case counts are lower in the post-law period than previously. However, the downward trend began before the mask law date and cases plateaued after that time; also actuals are slightly above the best-fit forecast line (the yellow quadratic). So, so this is categorized as neutral evidence.
Rwanda
Mask Law Date: 19/04/2020
Aggregate Cases Functional Form: Close to Linear
Forecasts vs Actuals: Actuals higher than best-fit forecasts.
New Cases Bar Graph: New cases higher after mask-law date than before.
Categorization: 0 (Neutral Evidence)
Comment: The quadratic function nearly overlies the linear. The bar graph of new cases shows that there was actually declining trend in cases pre-law, then a strong increase in cases after the mask-law date, finally followed by a substantial decline. Post-law cases were higher than pre-law forecasts. So, this evidence is mixed, so it will be classed as neutral.

San Marino
Mask Law Date: 30/04/2020
Aggregate Cases Functional Form: Concave Down
Forecasts vs Actuals: Actuals less than best-fit forecasts.
New Cases Bar Graph: New cases lower after mask-law date than before.
Categorization: 1 (Weak Positive Evidence)
Comment: The quadratic is concave down, but the bar graph of new cases shows that the downward trend was established well before the mask law date. Post-law actuals were less than pre-law forecasts, however. Given that the new case count was somewhat lower than the existing trend, this is classed as weak positive evidence.
Sao Tome and Principe
Mask Law Date: 22/04/2020
Aggregate Cases Functional Form: Concave Up
Forecasts vs Actuals: Actuals higher than best-fit forecasts.
New Cases Bar Graph: New cases higher after mask-law date than before.
Categorization: -2 (Strong Negative Evidence)
Comment: The quadratic function is concave up and the bar graph shows a big jump
shortly after the mask law date, then declines and stays at a level that
is much higher than in the pre-law period. The pre-law data is too sparse for a reasonable projection to be made, but it is much higher than the linear forecast that was available. However, the large increase that occurred after the mask-law date is difficult to reconcile as anything other than strong negative evidence against the mask-law hypothesis.
Saudi Arabia
Mask Law Date: 30/05/2020
Aggregate Cases Functional Form: Concave Up
Forecasts vs Actuals: Actuals higher than best-fit forecasts.
New Cases Bar Graph: New cases higher after mask-law date than before.
Categorization: -2 (Strong Negative Evidence)
Comment: The quadratic is concave up and the new cases bar graph shows an increase in cases after the mask law date, which remain substantially higher than in the pre-law period. Actuals are a bit higher than the pre-law best fit forecast. Therefore, this is classed as strong negative evidence against the mask-law hypothesis.
Senegal
Mask Law Date: 20/04/2020
Aggregate Cases Functional Form: Concave Up
Forecasts vs Actuals: Actuals higher than best-fit forecasts.
New Cases Bar Graph: New cases higher after mask-law date than before.
Categorization: -2 (Strong Negative Evidence)
Comment: The quadratic is concave up and the new case count graph shows cases rising consistently after the mask law date. Post-law actuals are much higher than pre-law forecasts. So, this is categorized as strong negative evidence.
Serbia
Mask Law Date: 29/04/2020
Aggregate Cases Functional Form: Concave Down
Forecasts vs Actuals: Actuals lower than best-fit forecasts.
New Cases Bar Graph: New cases lower after mask-law date than before.
Categorization: 2 (Strong Positive Evidence)
Comment: The quadratic is concave down, though the blue bar graph shows that the decreasing trend in new cases began before shortly the mask-law date. However, post-law actuals are well below the best-fit pre-law forecasts. This, then is classed as strong positive evidence.
Sierra Leone
Mask Law Date: 22/04/2020
Aggregate Cases Functional Form: Concave Up
Forecasts vs Actuals: Actuals are higher than best-fit forecasts.
New Cases Bar Graph: New cases are higher after mask-law date than before.
Categorization: -2 (Strong Negative Evidence)
Comment: The quadratic function is strongly concave up and the new case counts rise consistently and exponentially after the mask law date. Actuals are much higher than predicted from pre-law forecasts. So, this is classed as strong negative evidence against the mask-law hypothesis.
Singapore
Mask Law Date: 14/04/2020
Aggregate Cases Functional Form: Concave Up
Forecasts vs Actuals: Actuals are generally higher than best-fit forecasts.
New Cases Bar Graph: New cases are higher after mask-law date than before.
Categorization: -2 (Strong Negative Evidence)
Comment: The quadratic function is concave up and the case counts increase dramatically after the mask-law date, though they do plateau. Post-law actuals are generally higher than pre-law forecasts. Thus, this is strong negative evidence against the mask-law hypothesis.
SlovakiaMask Law Date: 25/03/2020
Aggregate Cases Functional Form: Concave Up
Forecasts vs Actuals: Actuals higher than best-fit forecasts.
New Cases Bar Graph: New cases higher after mask-law date than before.
Categorization: -2 (Strong Negative Evidence)
Comment: Again, the quadratic function is concave up and the new case bar graph shows an exponential rise throughout the study period. In addition, post-law actuals are somewhat higher than pre-law best-fit forecasts. So, this is strong negative evidence against the mask-law hypothesis.
Slovenia
Mask Law Date: 29/03/2020
Aggregate Cases Functional Form: Close to Linear
Forecasts vs Actuals: Actuals lower than best-fit forecasts.
New Cases Bar Graph: New cases are lower after mask-law date than before.
Categorization: 2 (Strong Positive Evidence)
Comment: The quadratic and linear functions overlie each other. The new case count bar graph shows the hump-like form, indicative of a strong positive evidence instance (rising cases before the mask-law date followed by declining cases after the mask-law date. Post-law actuals are below the best-fit pre-law forecast. Thus, this is strong positive evidence, in favour of the mask-law hypothesis.
South Africa
Mask Law Date: 01/05/2020
Aggregate Cases Functional Form: Concave Up
Forecasts vs Actuals: Actuals higher than best-fit forecasts.
New Cases Bar Graph: New cases higher after mask-law date than before.
Categorization: -2 (Strong Negative Evidence)
Comment: The quadratic function is strongly concave up and the bar graph of new cases shows a picture-perfect example of an exponential rise. As well, the post-law actuals are considerably higher than pre-law forecasts. Therefore this case is an excellent example of strong negative evidence against the mask-law hypothesis.
Spain
Mask Law Date: 02/05/2020
Aggregate Cases Functional Form: Concave Down
Forecasts vs Actuals: Actuals higher than best-fit forecasts.
New Cases Bar Graph: New cases lower after mask-law date than before.
Categorization: 0 (Neutral Evidence)
Comment: The quadratic function is concave down and the count of new cases is steadily downwards and lower in the post-law period than in the pre-law period. However it is clear from the bar graph that the downward trend had started well before the mask-law date. In addition, the post-law actuals are a bit higher than the pre-law best-fit forecast (the logarithmic). Thus, though cases did drop steadily, this is the continuation of a continuing trend, and is therefore classed as neutral evidence.
Sri Lanka
Mask Law Date: 11/04/2020
Aggregate Cases Functional Form: Concave Up
Forecasts vs Actuals: Actuals higher than best-fit forecasts.
New Cases Bar Graph: New cases higher after mask-law date than before.
Categorization: -2 (Strong Negative Evidence)
Comment: The quadratic is strongly concave up and weekly case counts rise considerably after the mask-law date (they are down somewhat in the final week, though still much higher than pre-law). Also, post-law cases are higher than pre-law forecasts. Therefore this is categorized as strong negative evidence.
Switzerland
Mask Law Date: 29/10/2020
Aggregate Cases Functional Form: Concave Up
Forecasts vs Actuals: Actuals lower than best-fit forecasts.
New Cases Bar Graph: New cases decrease after mask-law date compared with before.
Categorization: 2 (Strong Positive Evidence)
Comment: The quadratic function is slightly concave up, but the weekly new case count bar graph has the characteristic hump shape of a case that is strongly positive for the mask-law hypothesis. In addition, post-law actuals are below pre-law best-fit forecasts (the yellow quadratic). Thus, this is categorized as strong positive evidence in favour of the mask-law hypothesis.
Thailand
Mask Law Date: 25/03/2020
Aggregate Cases Functional Form: Concave Up
Forecasts vs Actuals: Actuals lower than best-fit forecasts.
New Cases Bar Graph: New cases lower after mask-law date than before.
Categorization: 2 (Strong Positive Evidence)
Comment: The quadratic function is slightly concave up but the weekly new case bar graph shows the hump-like form, with a peak just after the mask-law date, that is indicative of strong positive evidence. Also, the post-law actuals are below the pre-law best-fit forecast. Thus this is classed as strong positive evidence for the mask-law hypothesis.
Timor-Leste
Mask Law Date: 26/04/2020
Aggregate Cases Functional Form: Concave Down
Forecasts vs Actuals: Actuals lower than best-fit forecasts.
New Cases Bar Graph: New cases lower after mask-law date than before.
Categorization: 2 (Strong Positive Evidence)
Comment: The quadratic is strongly concave down and the weekly new case graph shows a steep reduction in cases after the mask-law date. In addition, the post-law actuals are well below the pre-law forecasts. Thus, though the Ns are rather small, the drop in cases is sufficiently convincing to call this strong positive evidence.
Trinidad and Tobago
Mask Law Date: 06/04/2020
Aggregate Cases Functional Form: Concave Down
Forecasts vs Actuals: Actuals lower than best-fit forecasts.
New Cases Bar Graph: New cases lower after mask-law date than before.
Categorization: 0 (Neutral Evidence)
Comment: The quadratic is concave down and the weekly new case counts are far lower after the mask-law date. Actuals are lower than forecasts. However, the weekly bar graph shows that this is the continuation of a trend that began well before the mask-law, so this instance is classed as neutral evidence, neither for or against the mask-law hypothesis.
Tunisia
Mask Law Date: 07/04/2020
Aggregate Cases Functional Form: Close to Linear
Forecasts vs Actuals: Actuals lower than best-fit forecasts.
New Cases Bar Graph: New cases lower after mask-law date than before.
Categorization: 0 (Neutral Evidence)
Comment: The quadratic and linear functions almost overlie each other. The weekly new case count does show counts of new cases dropping after the mask-law date, and post-law actuals are lower than pre-law forecasts. However, the weekly bar graph of new cases shows that this trend appears to have have begun several weeks before the mask-law date. So, this case will also be categorized as neutral evidence.
Turkey
Mask Law Date: 03/04/2020
Aggregate Cases Functional Form: Concave Up
Forecasts vs Actuals: Actuals higher than best-fit forecasts.
New Cases Bar Graph: New cases higher after mask-law date than before.
Categorization: 0 (Neutral Evidence)
Comment: The quadratic function is concave up. The graph does have the hump-like form of a strongly positive case, but the peak is shifted until well into the post-law period. Post-law actuals are higher than pre-law forecasts. Thus, the overall conclusion is that this is neutral evidence, as regards the mask-law hypothesis.
Uganda
Mask Law Date: 06/05/2020
Aggregate Cases Functional Form: Concave Up
Forecasts vs Actuals: Actuals higher than best-fit forecasts.
New Cases Bar Graph: New cases higher after mask-law date than before.
Categorization: -2 (Strong Negative Evidence)
Comment: The quadratic function function is strongly concave up. The bar graph of weekly new cases rises in an almost exponential manner, save week 3 after the mask law, which drops back to pre-law levels, after which cases jump tremendously again. Post-law actuals are much higher than pre-law forecasts. So this is classed as strong negative evidence.
Ukraine
Mask Law Date: 07/04/2020
Aggregate Cases Functional Form: Concave Up
Forecasts vs Actuals: Actuals higher than best-fit forecasts.
New Cases Bar Graph: New cases higher after mask-law date than before.
Categorization: -2 (Weak Negative Evidence)
Comment: The quadratic function is strongly concave up and the weekly new case counts rise in an exponential manner throughout the period. Post-law actuals are much higher than best-fit pre-law forecasts. So, this is strongly negative evidence against the mask-law hypothesis.
United Arab Emirates
Mask Law Date: 28/04/2020
Aggregate Cases Functional Form: Concave Up
Forecasts vs Actuals: Actuals mirror than best-fit forecasts.
New Cases Bar Graph: New cases higher after mask-law date than before.
Categorization: -2 (Strong Negative Evidence)
Comment: The quadratic function is concave up and cases rise throughout the period in an exponential manner. Post-law actuals mirror pre-law forecasts. So, this is strongly negative evidence, as regards the mask-law hypothesis.
United Kingdom
Mask Law Date: 15/06/2020
Aggregate Cases Functional Form: Close to Linear
Forecasts vs Actuals: Actuals about the same as best-fit forecasts.
New Cases Bar Graph: New cases lower after mask-law date than before.
Categorization: 0 (Neutral Evidence)
Comment: The quadratic function and the linear function overlie each other. Weekly case counts are low during the post-law period, relatively to pre-law. However, the bar chart clearly shows that cases began falling well before the mask-law date. The post-law actuals are actually lower than the best-fit forecast (the quadratic), though all of the forecast functions give rather similar results, and the actuals are midway between them. So, given the trends, this is categorized as neutral evidence.
Uruguay
Mask Law Date: 23/04/2020
Aggregate Cases Functional Form: Concave Down
Forecasts vs Actuals: Actuals higher than best-fit forecasts.
New Cases Bar Graph: New cases fall after mask-law date than before.
Categorization: 2 (Strong Positive Evidence)
Comment: The quadratic function is concave down and case counts are lower after the mask law than before. Cases rise in the first week post-law, but then quickly fall back down. Post-law actuals are somewhat above the best-fit pre-law forecast line (the logarithmic), but well below the others. So, though there is some mixed evidence, this is classed as strong positive evidence for the mask law, given the drop-off in cases after the mask-law.
Uzbekistan
Mask Law Date: 22/03/2020
Aggregate Cases Functional Form: Concave Up
Forecasts vs Actuals: Actuals higher than best-fit forecasts.
New Cases Bar Graph: New cases higher after mask-law date than before.
Categorization: -2 (Strong Negative Evidence)
Comment: The quadratic function is strongly concave up and the weekly new case counts rise in an exponential fashion after the mask law date. Post-law actuals are far above pre-law best-fit forecasts. So this is a prime example of strongly negative evidence against the mask-law hypothesis.
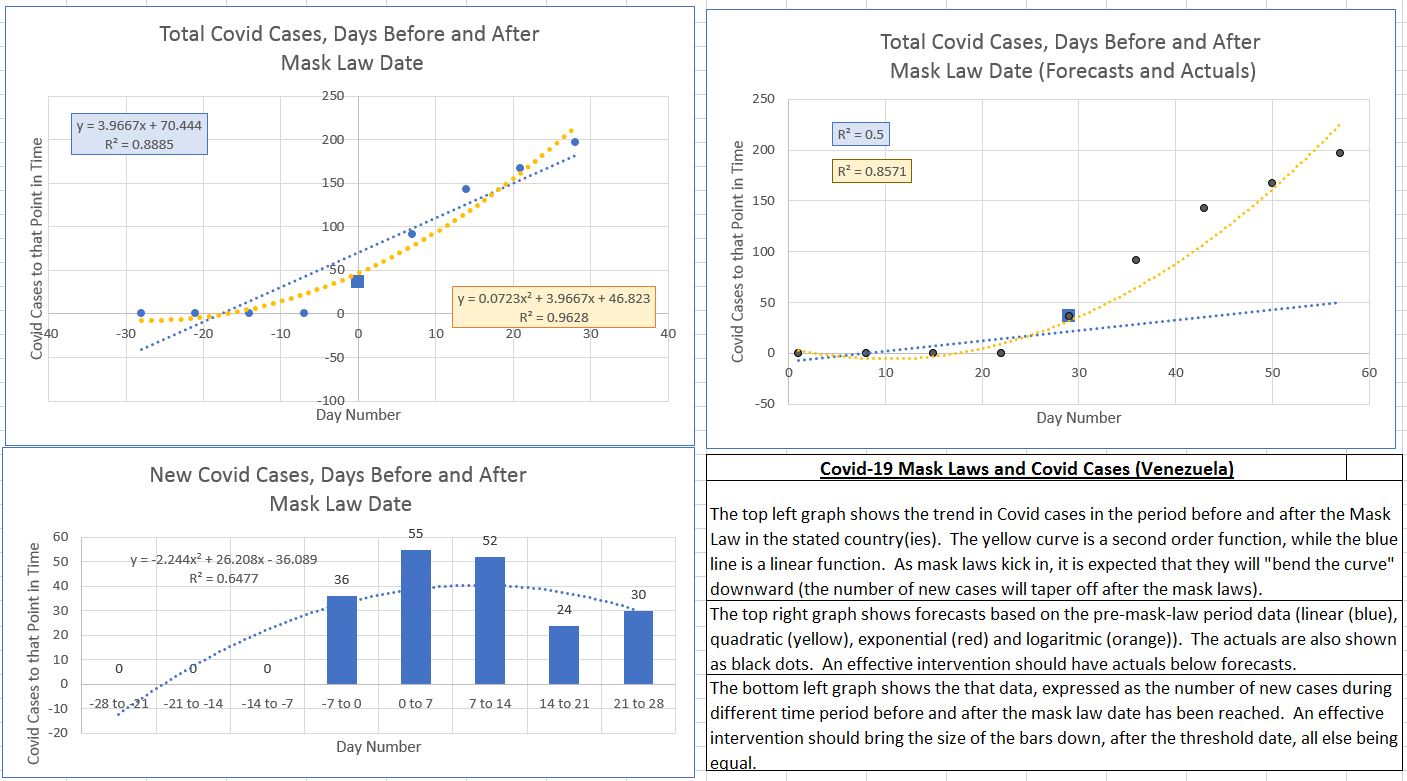
Venezuela
Mask Law Date: 18/03/2020
Aggregate Cases Functional Form: Concave Up
Forecasts vs Actuals: Actuals higher than best-fit forecasts.
New Cases Bar Graph: New cases higher after mask-law date than before.
Categorization: -2 (Strong Negative Evidence)
Comment: The quadratic is strongly concave up and weekly case counts climb substantially after the mask-law date. Post-law actuals are higher than forecasts. Thus, this is strong negative evidence against the mask-law hypothesis.
Vietnam
Mask Law Date: 18/03/2020
Aggregate Cases Functional Form: Concave Up
Forecasts vs Actuals: Actuals higher than best-fit forecasts.
New Cases Bar Graph: New cases higher after mask-law date than before.
Categorization: 1 (Weak Positive Evidence)
Comment: The quadratic function is concave up. The bar graph has the hump-like shape of indicative of positive evidence, but the peak comes well into the post-mask law period, so this is classed as weak positive evidence.
Zambia
Mask Law Date: 18/04/2020
Aggregate Cases Functional Form: Concave Up
Forecasts vs Actuals: Actuals higher than best-fit forecasts.
New Cases Bar Graph: New cases higher after mask-law date than before.
Categorization: -1 (Weak Negative Evidence)
Comment: The quadratic function is strongly concave up and case counts rise exponentially after the mask-law date, though they do fall back down at the final week. Post-law actuals are well above the best-fit forecast line, for the most part. Given the drop in cases in the final week, this is an classed as weak negative evidence.
Zimbabwe
Mask Law Date: 01/05/2020
Aggregate Cases Functional Form: Concave Up
Forecasts vs Actuals: Actuals above than best-fit forecasts.
New Cases Bar Graph: New cases higher after mask-law date than before.
Categorization: -2 (Strong Negative Evidence)
Comment: The quadratic is strongly concave up. Case counts remain low after the mask-law date for most of the post-law period, but then increase dramatically at the end. Actuals are slightly below the best-fit forecast, but also rise sharply at the end. So, given the large increase at week 4 of the post-law period, this is best considered as strongly negative evidence.
A Quick Summary of these 31 Cases
(+2) Strong Positive Evidence in favour of the mask-law hypothesis: 6 countries
(+1) Weak Positive Evidence in favour of the mask-law hypothesis: 2 countries
(0) Neutral Evidence, neither for or against the mask-law hypothesis: 7 countries
(-1) Weak Negative Evidence against the mask-law hypothesis: 1 countries
(-2) Strong Negative Evidence against the mask-law hypothesis: 15 countries


No comments:
Post a Comment