Covid-19 - (Part 1) A World-Wide Test of the Mask-Law Hypothesis - Detailed Statistics, Algeria to Cuba
Introduction
The use of masks and mask-laws to prevent Covid-19 infections is obviously a huge, multi-faceted, complex and controversial subject. There are a lot of lines of evidence, sometimes contradictory, ranging from detailed medical studies (e.g. hospital ICU studies), to engineering studies (e.g. viral aerosol particle hang-time indoors), to ecological studies (how did mask-laws seem to affect infection rates in various situation).
So, intrepidly and perhaps foolishly, I thought I would add to the discussion via looking at how mask-laws seemed to have actually worked around the world, on a national level. I used publicly available data sources (as outlined below) and relied on primarily graphical evidence, supplemented by simple curve-fitting, to examine and judge the evidence as objectively as I possibly could. I also state the methods that I used and the overall hypothesis that the data will be used to test.
The evidence and my judgments are shown below, and in three more blogs, on a case-by-case basis. I broke the data in to 4 blogs, as there are some 123 countries that had mask-laws in the data, and I didn't want to overwhelm the reader with that much data all at once.
An
accompanying blog will give my analysis of the overall conclusions,
taking into account the evidence of the 123 countries as a whole. However, by presenting the evidence in this way, it is my intention that anyone (statistician or interested layperson) can look at the data and draw their own conclusions.
As for my own qualifications, I am a statistician (or data scientist, a popular new term) who does operational research for a large Canadian university. Covid-19 isn't my area of expertise but data analysis of this sort (practical observational studies of the effect of targeted interventions on a population) is a fairly broad area, one with which I am familiar. But, as I say, interested readers should scan through the graphs and narratives and form their own conclusions.
Statement of Hypothesis and Description of Method of Evaluation
For my purposes the Mask-Law Hypothesis can be stated as: "A national mask-law will result in the number of new Covid-19 cases coming down within the one month period after the mask-law date, relative to the trend in the one month period before that date". It has often expressed in more informal terms as "a mask-law will help bend the curve downwards".
Since observational studies of this sort have many potential confounders, the hypothesis can be restated in a form that attempts to control for these confounders, by analyzing a large number of cases, on the assumption that the effects of these confounding variables will tend to cancel out as the number of cases increases. The restated form of the hypothesis is then: "National mask-laws will result in new Covid-19 cases coming down within
the one month period after the mask-law date, relative to the trend in
the one month period before that date, in the vast majority of countries in which the mask-law is implemented".
Below are the detailed, country-by-country statistics for Covid-19 cases by days before and after that particular country's mask-law, as indicated on the source Masks4All website (which provided the mask-law date) and the GitHub repository of Covid-19 statistics (which provided the aggregate number of cases during the study period, by day).
The graphs show:
- Line graphs of aggregate case counts in the 4 week periods before and after the law, to obtain an overall sense of how the numbers evolved during the study period. Linear and quadratic functions are fit to the data, to give a visual and mathematical basis for determining whether the general trend was up, flat or down in that country during the 8 week period.
- Line graphs with forecasts of cases for the four weeks after the mask-law, based on the trend during the four weeks before the law, along with the actual results during that succeeding four weeks. This enables a comparison of forecasts and actuals, to determine whether or not the pre-law trend in cases appeared to be affected by the mask-law. Generally speaking, the two best fitting functions of the linear, quadratic, exponential and logarithmic cases are shown (determined by R-square, a conventional measure of model fitness, where the best forms have R-square closest to 1.00).
- A bar graph with the number of new cases each week during that time, as well as the functional form that best fits that data. This gives a visual and mathematical picture of how new cases varied on a weekly basis.
I use this data to judge how well the evidence supports the mask-law's apparent effectiveness for each country. Readers may sometimes dispute my opinion, though I think the majority of cases are not too difficult to categorize. However, although the evidence for or against the mask-law hypothesis is sometimes quite clear-cut, at other times it is only somewhat persuasive and sometimes it is too inconclusive to render any sort of judgment.
The upper left hand corner graphs, giving the functional forms (visually and mathematically) for the aggregate data are measures of how well the mask-laws seem to be doing in their expected roles (i.e. bending the curve downwards).
- Concave Down -The second order polynomial fit to the data (the yellow line) tends to bend downwards. This is generally supportive of the mask-laws (positive evidence), though in some cases this could just be the continuation of a trend that began before the law was passed.
- Linear - The second order polynomial and the linear function nearly overlie each other, indicating that the number of new cases was essentially steady during the period. This would not be supportive of the mask-law's effectiveness (neutral evidence), though it could be argued that the mask-law prevented an exponential increase.
- Concave Up - The second order polynomial fit to the data (the yellow line) tends to
bend upwards. This is generally not supportive of the mask-laws (negative evidence). Indeed, it could be argued that in these cases the mask-law not only didn't work, but actually contributed to making the situation worse (perhaps by creating a false sense of security).
The upper right hand corner graphs show the forecast of cases, based on the four weeks of data before the mask-law date. As noted, some alternative trend lines are given, those which best fit the pre-law data (based on their R-square, a statistical measure of goodness-of-fit).
I should note that forecasts of this sort, based on limited data, can be misleading, so you have to use your common sense as well as the statistical R-square measure, when deciding whether they are appropriate. For example, exponential functions don't generally apply over a very long range of data in the real world (resources eventually run out), so care has to be taken when utilizing them. Also, a quadratic function can predict a decline in aggregate cases, which is physically impossible, so care must be taken to not rely on this form in these instances.
The actual case counts during the four weeks after the mask-law are also shown. Again, there are three main possibilities:
- Actuals Below the Trend - If the number of cases are below the forecasts, that indicates that the mask-law appears to have slowed or reversed the trend. This is generally supportive of the mask law's effectiveness (positive evidence for the mask-law hypothesis).
- Actuals Mirror Trend - If the number of cases are very close to the forecast, that indicates that the mask-law had no observable effect on the trend. This would not be supportive of the mask- law's effectiveness, but wouldn't indicate that the mask-law was counter-productive (neutral evidence as regards the mask-law hypothesis).
- Actuals Above the Trend - If the number of cases exceeds the forecasts, that indicates that cases
grew faster than the pre-existing trend and that the the mask-law did
not slow the trend, it may have even sped it up. This is generally not supportive of the mask-law's effectiveness (negative evidence against the mask-law hypothesis).
The lower left hand bar graphs give the number of new cases, on a week-by-week basis, before and after the mask-law. It also has as best-fit function for the new cases data, to aid the visual interpretation. There are three main ideal-type cases, as well as many intermediate possibilities:
- The graph has a hump-like shape, with new cases rising before the mask-law date, peaking shortly after the mask-law, then falling. This is generally supportive of the mask-law's effectiveness (positive evidence for the mask-law hypothesis).
- The graph is more or less flat, with no strong pattern of growth or shrinkage over the course of the eight week period. This would not be supportive of the mask-law's effectiveness, but
wouldn't indicate that the mask-law was counter-productive (neutral
evidence as regards the mask-law hypothesis).
- The graph shows steady, often exponential, growth after the mask-law date, compared to before that date. This is generally not supportive of the mask-law's effectiveness (negative evidence against the mask-law hypothesis).
The three lines of evidence are then considered and an overall evaluation is given, via a five-level categorization. The categories are given below:
- Category 2: Strong positive evidence. The aggregate case graph is generally downward, actual cases are below the pre-law forecasts and new cases clearly fall after the mask-law date.
- Category 1: Weak positive evidence. The majority of the lines of evidence favour the mask-law, but the evidence is relatively weak and/or has some contrary indications.
- Category 0: Neutral evidence. None of the lines of evidence show very persuasive evidence, one way or the other.
- Category -1: Weak negative evidence. The majority of the lines of evidence do not favour the mask-law, but the
evidence is relatively weak and/or has some contrary indications.
- Category -2: Strong negative evidence. The aggregate case graph is generally upward, actual cases are above the
pre-law forecasts and new cases clearly rise (often exponentially) after the mask-law date.
Since there are 123 countries in the study, I will have to break the data into several blogs, just to avoid overloading blogger with graphs. This is Part 1, with countries from Algeria to Cuba (alphabetically ordered). Note that not all countries passed mandatory mask laws and therefore not all countries could be included in this study.
Algeria
Mask-Law Date: 18/05/2020
Aggregate Cases Functional Form: Close to Linear
Forecasts vs Actuals: Actuals below forecasts.
New Cases Bar Graph: New cases lower after mask-law date than before.
Categorization: 2 (Strong Positive evidence for the mask-law hypothesis)
Comment: The hump-like appearance of the bar graph of new cases is almost ideal evidence to support the mask-law's efficacy. Cases rise steadily until the mask-law date, then fall off steadily. Also, post-law cases are lower than pre-law forecasts. This would support the idea that the mask-law worked as was hoped for in this country, and is therefore classed as strong positive evidence for the mask-law hypothesis.

Andorra
Mask-Law Date: 18/04/2020
Aggregate Cases Functional Form: Concave Down
Forecasts vs Actuals: Actuals about the same as forecasts.
New Cases Bar Graph: New cases lower after mask-law date than before.
Categorization: 1 (Weak positive evidence for the mask-law hypothesis)
Comment: Though, the curve is bending downwards, the best-fit forecast graphs and bar graph of new cases indicate that this downwards trend had been established before the mask law. That said, it could be argued that the downward trend was reinforced by the mask-law, as new cases in the bar graph are somewhat below the trend. So, this is classed as weak positive evidence.

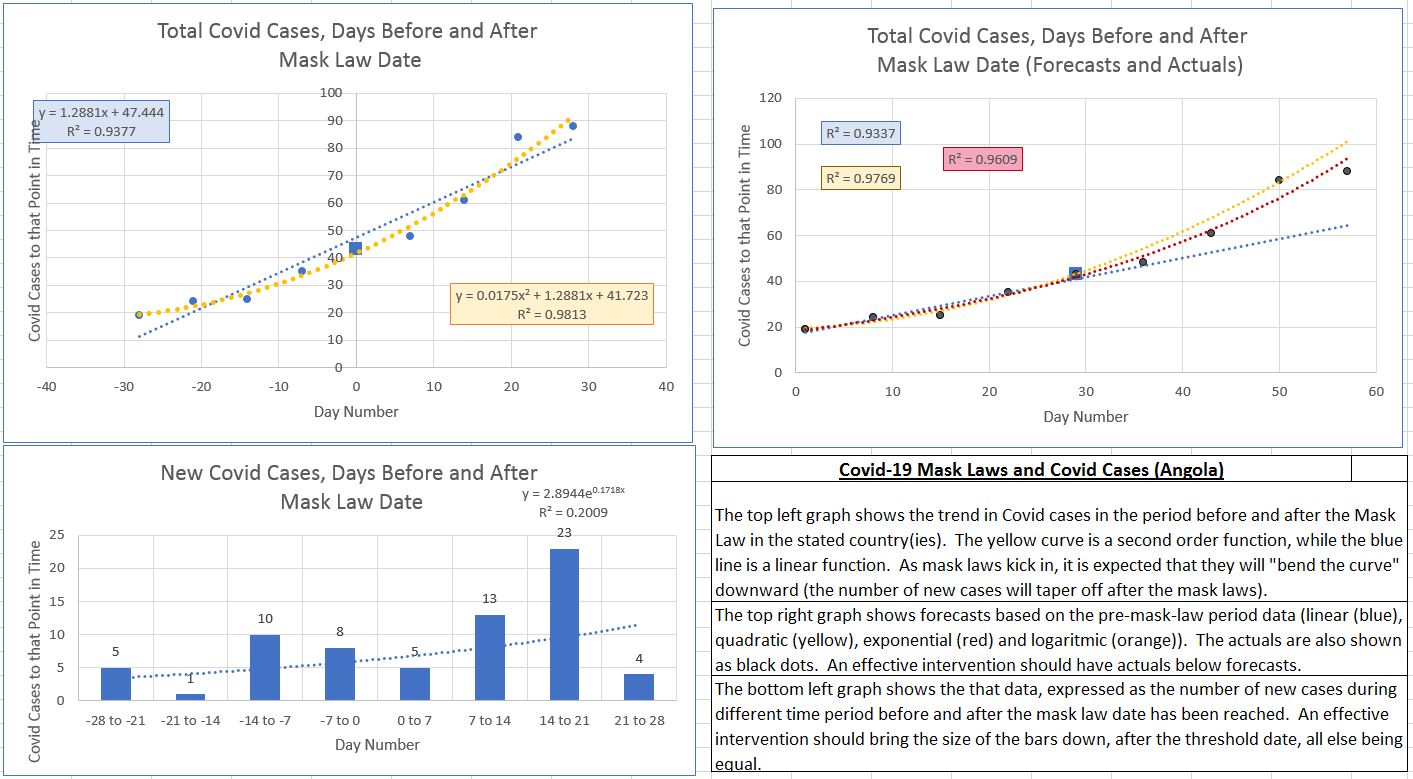
Angola
Mask Law Date: 09/05/2020
Aggregate Cases Functional Form: Concave Up
Forecasts vs Actuals: Actuals about the same as forecasts.
New Cases Bar Graph: New cases higher after mask-law date than before.
Categorization: -1 (Weak negative evidence)
Comment:
Though, the curve is bending upwards, the bar graph indicates that
the trends before and after the mask-law were somewhat mixed. The increases by the 2nd and 3rd post-law week were significant, though week 4 saw a turnaround. However, as new case counts were generally higher after the mask-law date than before, and post-law actuals were about the same as pre-law forecasts, this is considered weak negative evidence against the mask-law hypothesis.
Antigua and Barbuda
Mask Law Date: 06/04/2020
Aggregate Cases Functional Form: Concave Down
Forecasts vs Actuals: Actuals lower than forecasts.
New Cases Bar Graph: New cases lower after mask-law date than before.
Categorization: 2 (Strong Positive evidence)
Comment: The curve is bending slightly downwards, and the bar graph indicates that
the trend before the mask-law was upwards but afterwards was downwards. Cases are well below the best R-square forecast curve. The main problem with this case is simply that the small underlying population leads to small numbers of cases and less statistical power than a larger population (i.e. could be due to chance). Nonetheless, the hump-like shape of the bar graph leads this to being classed as strong positive evidence.
Argentina
Mask Law Date: 20/04/2020
Aggregate Cases Functional Form: Concave Up
Forecasts vs Actuals: Actuals higher than forecasts.
New Cases Bar Graph: New cases higher after mask-law date than before.
Categorization: -2 (Strong Negative evidence)
Comment: The curve is bending up strongly and the bar graph shows a nearly exponential rise in cases after the mask law. Post-law actual cases are far above what the pre-law forecasts predicted. So, this is strong negative evidence against the mask-law hypothesis.

Armenia
Mask Law Date: 18/05/2020
Aggregate Cases Functional Form: Concave Up
Forecasts vs Actuals: Actuals higher than forecasts.
New Cases Bar Graph: New cases higher after mask-law date than before.
Categorization: -2 (Strong Negative evidence)
Comment: The curve is bending up strongly and the bar graph shows a nearly
exponential rise in cases after the mask law. Also, post-law actuals are above the best-fitting pre-law forecast curve. So, this is strong
negative evidence against the mask-law hypothesis.

Austria
Mask Law Date: 30/03/2020
Aggregate Cases Functional Form: Close to Linear
Forecasts vs Actuals: Actuals lower than forecasts.
New Cases Bar Graph: New cases lower after mask-law date than before.
Categorization: 2 (Strong Positive evidence)
Comment: The curve is bending downwards and the bar graph of new cases rises before the mask law, then descends throughout the 4 week post-law period (hump-like shape). Actuals are far below the best R-square forecast method. This is strong evidence for the mask law hypothesis.
Azerbaijan
Mask Law Date: 01/05/2020
Aggregate Cases Functional Form: Concave Up
Forecasts vs Actuals: Actuals higher than forecasts.
New Cases Bar Graph: New cases higher after mask-law date than before.
Categorization: -2 (Strong Negative)
Comment: The quadratic curve is bending strongly upwards. The bar graph shows case counts falling steadily, then rising after the mask law date, essentially exponentially. Actuals are far above all of the forecast methods. This is exactly opposite of what is expected from the mask-law hypothesis, so it is strongly negative evidence against that hypothesis.
Bahamas
Mask Law Date: 19/04/2020
Aggregate Cases Functional Form: Concave Down
Forecasts vs Actuals: Actuals lower than forecasts.
New Cases Bar Graph: New cases lower after mask-law date than before.
Categorization: 1 (Weak Positive)
Comment: The quadratic curve is bending downwards as expected. Actuals are somewhat below forecasts. However the trend in the bar chart of pre-law and post-law new case counts are rather inconsistent (up, then down, then up, then down, then up, then down), so this is weak positive evidence.
Bahrain
Mask Law Date: 09/04/2020
Aggregate Cases Functional Form: Concave Up
Forecasts vs Actuals: Actuals above or same as best-fit forecasts.
New Cases Bar Graph: New cases higher after mask-law date than before.
Categorization: -2 (Strong Negative)
Comment: The quadratic fit is bending up sharply, while the new case count rises after the mask-law date, rather than falls. Actuals are at the same level as the exponential forecast and much higher than the quadratic (these two have nearly identical R-square values). So, this can be considered to be strongly negative evidence against the mask-law hypothesis.

Bangladesh
Mask Law Date: 15/06/2020
Aggregate Cases Functional Form: Close to Linear
Forecasts vs Actuals: Actuals below forecasts.
New Cases Bar Graph: New cases lower after mask-law date than before.
Categorization: 2 (Strong Positive)
Comment: The quadratic function almost overlies the linear function (in fact it is slightly concave up), but the bar graph shows the hump-like shape typical of strong positive evidence (though the case count has not come down immediately or very rapidly). Actuals are well below the exponential fit forecast and slightly below the quadratic fit forecast (these have nearly identical R-square values). So, this can be put in the strong positive evidence category.
Barbados
Mask Law Date: 12/05/2020
Aggregate Cases Functional Form: Concave Down
Forecasts vs Actuals: Actuals about the same as forecasts.
New Cases Bar Graph: New cases lower after mask-law date than before.
Categorization: 1 (Weak Positive)
Comment: The quadratic function of total cases turns down slightly. Case counts fall after the mask-law date, but the data previous to that was rather low in several intervals too. Actuals were about the same as the best-fit forecast method (quadratic) and slightly below the other two. That said, the R-squares for all three methods were very close. So, this is classed as weak positive evidence for the mask-law hypothesis.
Belgium
Mask Law Date: 06/05/2020
Aggregate Cases Functional Form: Concave Down
Forecasts vs Actuals: Actuals above the best-fit forecasts.
New Cases Bar Graph: New cases lower after mask-law date than before.
Categorization: 0 (Neutral)
Comment: The quadratic is strongly downward in the aggregate cases graph, but examining the bar graph shows that case counts had been trending down throughout the pre-mask-law period, and there appears to be little or no change in the trend after the mask law. Actuals are above two of the forecasts methods (quadratic and logarithmic) but below the other two (linear and exponential). Note that all of these methods had quite high r-square values, though the quadratic forecast was the winner on that score (the fact that it has turned downwards towards the end makes it non-physical, though). Therefore, given the inconsistent results of the three lines of evidence, this is best considered as neutral evidence, neither for nor against the mask-law hypothesis.
Belize
Mask Law Date: 01/05/2020
Aggregate Cases Functional Form: Concave Down
Forecasts vs Actuals: Actuals below the best-fit forecasts.
New Cases Bar Graph: New cases lower after mask-law date than before.
Categorization: 0 (Neutral Evidence)
Comment: The total cases quadratic is strongly downward, but the bar graph shows that new case counts had been down (actually 0) before the mask-law, then continued that trend afterwards. The best-fit (using R-square) forecast was the quadratic, but that clearly doesn't work within this range of data, so the logarithmic is preferred. Actuals were slightly below that line. Given the conflicting lines of evidence and the extremely small number of cases, this data can best be categorized as neutral evidence, neither for nor against the mask-law hypothesis.
Benin
Mask Law Date: 08/04/2020
Aggregate Cases Functional Form: Concave Up
Forecasts vs Actuals: Actuals below the best-fit forecasts.
New Cases Bar Graph: New cases higher after mask-law date than before.
Categorization: -1 (Weak Negative Evidence)
Comment: The direction of the quadratic is strongly upward. The bar graph shows new cases climbing in the post-law weeks, relative to the pre-law weeks, though with some inconsistency. Actuals are slightly below the best-fit forecast, indicating that the rise in case could have been a bit higher without the mask-law. Nonetheless the number of cases after the mask-law is generally higher than before the law, so this can best be considered as weak negative evidence.
Bosnia and Herzegovina
Mask Law Date: 29/03/2020
Aggregate Functional Form: Concave Up
Forecasts vs Actuals: Actuals about the same as the best-fit forecasts.
New Cases Bar Graph: New cases higher after mask-law date than before.
Categorization: 1 (Weak Positive Evidence)
Comment: Although the quadratic function has an upward curve, the bar graph shows that new cases had been rising before the mask law, peaked shortly after the law was enacted, then fell. Actuals are a a bit above the best-fit forecasting method (quadratic) for some of the range, then below at the end. Though there is some conflicting evidence, the hump-like form of the bar graph is quite persuasive, so this can be considered to be weak positive evidence for the mask law hypothesis, though admittedly a bit delayed.
Botswana
Mask Law Date: 01/05/2020
Aggregate Cases Functional Form: Close to Linear
Forecasts vs Actuals: Actuals above the best-fit forecasts.
New Cases Bar Graph: New cases higher after mask-law date than before.
Categorization: -1 (Weak Negative Evidence)
Comment: The quadratic function almost overlays the linear function and the bar graph shows about the same level of case counts previous to the mask law as afterwards. The actuals are higher than two of the three forecast graphs (all have R-square values of .93 and above). But the very fact that cases rise after the mask-law date, after having fallen to 0 is not favourable for the mask-law hypothesis. Since case counts are low, this will be considered to be weak negative evidence against the mask-law hypothesis.
Bulgaria
Mask Law Date: 30/03/2020
Aggregate Cases Functional Form: Concave Up
Forecasts vs Actuals: Actuals lower than the best-fit forecast.
New Cases Bar Graph: New cases higher after mask-law date than before.
Categorization: 1 (Weak Positive Evidence)
Comment: The second order function is strongly upwards and the bar graph shows a definite tendency for new cases to increase after the mask law has been put in. However, the post-law actuals are lower than the best-fit forecast graph, indicating that the mask-law might have had some success in slowing the pandemic rise, at least for a few weeks. Though the case has some contradictory features, it can be considered as weak positive evidence for the mask-law hypothesis.
Burkina Faso
Mask Law Date: 27/04/2020
Aggregate Cases Functional Form: Concave Down
Forecasts vs Actuals: Actuals lower than the best-fit forecast.
New Cases Bar Graph: New cases higher after mask-law date than before.
Categorization: 0 (Neutral Evidence)
Comment: The second order function is trending downwards, and the new case count after the mask law is down, compared to the situation before the law (though with some inconsistency). The actuals are midway between the linear fit and the quadratic fit in the forecast graph (they have nearly identical R-square values). However, a good case could be made that a declining trend was evident before the law was passed, so this will be categorized as neutral evidence, neither for or against the mask-law hypothesis.
Cameroon
Mask Law Date: 14/04/2020
Aggregate Cases Functional Form: Concave Up
Forecasts vs Actuals: Actuals lower than the best-fit forecast.
New Cases Bar Graph: New cases higher after mask-law date than before.
Categorization: -2 (Strong Negative Evidence)
Comment: The quadratic function has a definite upward curve, and the bar graph shows a trend for increasing new case rates after the law was passed, particularly as the week before the mask-law date was down significantly from the week previous to that. Actuals were slightly lower than the best-fit forecast graph, though higher than the alternative forecast. Given the sharp rise in weekly cases, this can be categorized as strong negative evidence.
Canada (Alberta)
Mask Law Date: 01/07/2020
Aggregate Cases Functional Form: Concave Up
Forecasts vs Actuals: Actuals higher than the best-fit forecast.
New Cases Bar Graph: New cases higher after mask-law date than before.
Categorization: -2 (Strong Negative Evidence)
Comment: The quadratic has a concave up shape and the new case counts have an exponentially increasing form, especially after the mask law is enacted. Actuals are higher than any of the forecasts. So this can be considered to be strongly negative evidence for the mask hypothesis. Note that Canada's mask laws were at the provincial level, so I selected this one example to highlight (also, I live in Alberta, so it naturally interests me).

Central African Republic
Mask Law Date: 12/06/2020
Aggregate Cases Functional Form: Close to Linear
Forecasts vs Actuals: Actuals below the best-fit forecasts.
New Cases Bar Graph: New cases higher after mask-law date than before.
Categorization: 2 (Strong Positive Evidence)
Comment: The quadratic nearly overlays the linear function. Actuals are lower than both of the best-fit forecast graphs. The bar graph of new cases has the hump-like shape indicative of strong positive evidence for the mask law hypothesis, though the effect is somewhat delayed.
Chad
Mask Law Date: 07/05/2020
Aggregate Cases Functional Form: Concave Up
Forecasts vs Actuals: Actuals below the best-fit forecasts.
New Cases Bar Graph: New cases higher after mask-law date than before.
Categorization: 1 (Weak Positive Evidence)
Comment: The quadratic has a definite upward curve and the bar graph of new case counts is only slightly attenuated after the mask-law date from the week just before that date. Actuals are below the best-fit forecasts. Thus, this can be considered weak positive evidence.
Chile
Mask Law Date: 08/04/2020
Aggregate Cases Functional Form: Concave Up
Forecasts vs Actuals: Actuals about the same as the best-fit forecasts.
New Cases Bar Graph: New cases higher after mask-law date than before.
Categorization: -2 (Strong Negative Evidence)
Comment: The quadratic function has a strong upward tendency and the bar graph of new cases rises steadily, with substantial uptick at the last week. Actuals track the best-fit forecasts. Thus, this can be considered strongly negative evidence against the mask-law hypothesis.
Colombia
Mask Law Date: 08/04/2020
Aggregate Cases Functional Form: Concave Down
Forecasts vs Actuals: Actuals about the same as the best-fit forecasts.
New Cases Bar Graph: New cases lower after mask-law date than before.
Categorization: 0 (Neutral Evidence)
Comment: The quadratic bends downwards and the bar graph of new cases trends downwards as well. However, the latter trend began considerably before the mask law, so it appears to be the continuation of a pre-existing trend. Actuals are below the forecast trend from the first four weeks of data, though. So, given the conflicting evidence, this can be considered neutral, in terms of the mask-law hypothesis.
Congo
Mask Law Date: 30/04/2020
Aggregate Cases Functional Form: Concave Up
Forecasts vs Actuals: Actuals above the best-fit forecasts.
New Cases Bar Graph: New cases higher after mask-law date than before.
Categorization: -2 (Strong Negative Evidence)
Comment: The quadratic bends somewhat upwards, and the case count of new cases tends to increase after the mask law date. The actuals are well above the forecast trend. So, this is strongly negative evidence against the mask-law hypothesis.
Congo (DRC)
Mask Law Date: 30/04/2020
Aggregate Cases Functional Form: Concave Up
Forecasts vs Actuals: Actuals above the best-fit forecasts.
New Cases Bar Graph: New cases higher after mask-law date than before.
Categorization: -2 (Strong Negative Evidence)
Comment: The quadratic definitely bends upwards and the new case count has the classic exponential form of a pandemic out of control. Post-law actuals are above all of the pre-law forecasts. So, clearly this is strongly negative evidence against the mask-law hypothesis.
Costa Rica
Mask Law Date: 27/06/2020
Aggregate Cases Functional Form: Concave Up
Forecasts vs Actuals: Actuals above the best-fit forecasts.
New Cases Bar Graph: New cases higher after mask-law date than before.
Categorization: -2 (Strong Negative Evidence)
Comment: The quadratic has a strong upward concavity and the bar graph reveals that the new case count is increasing in an exponential fashion. Actuals are far above the forecast. So, this is strongly negative.
Croatia
Mask Law Date: 14/07/2020
Aggregate Cases Functional Form: Close to Linear
Forecasts vs Actuals: Actuals below the best-fit forecasts.
New Cases Bar Graph: New cases lower after mask-law date than before.
Categorization: 2 (Strong Positive Evidence)
Comment: The quadratic function almost overlays the linear function. However, the case counts do show the characteristic hump-like pattern, falling after the mask law date, though somewhat slowly. Actuals are below the best-fit forecast line. So, this can be categorized as strong evidence for the mask-law hypothesis.
Cuba
Mask Law Date: 02/04/2020
Aggregate Cases Functional Form: Concave Up
Forecasts vs Actuals: Actuals above the best-fit forecasts.
New Cases Bar Graph: New higher lower after mask-law date than before.
Categorization: -2 (Strong Negative Evidence)
Comment: The quadratic has a definite upward curve, and the new case bar graph continues to increase for most of the post-law period, though that tapers off at the end. However, actuals are above the forecasts. Thus, this can be categorized as strong negative evidence.
A Quick Summary of these 30 Cases
(+2) Strong Positive Evidence in favour of the mask-law hypothesis: 6 countries
(+1) Weak Positive Evidence in favour of the mask-law hypothesis: 6 countries
(0) Neutral Evidence, neither for or against the mask-law hypothesis: 4 countries
(-1) Weak Negative Evidence against the mask-law hypothesis: 3 countries
(-2) Strong Negative Evidence against the mask-law hypothesis: 11 countries


No comments:
Post a Comment