The Girl on the Train – Movie Revenues versus Book Sales
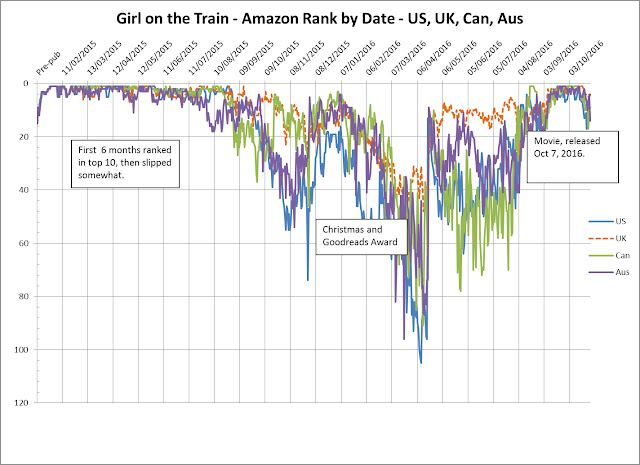
As many blog readers know, the book “The Girl on the Train”, has
been a top seller for most of 2015 and 2016, as can be seen in the
chart below. I got his data from the Amazon sites for the specified
countries. Basically I was just curious to track a top seller over a
long period, to watch its ebbs and flows, and see what sorts of
events affected its sales.
The book became very popular, right out of the gate in 2015, and
stayed in the top 10 or so in the four main English speaking markets
for most of that year. It lost steam by autumn, but was revived by
strong Christmas sales, then by being voted a “best book” in the
Goodreads reader site, early in 2016. Its sales rank then drifted up
into the 25 to 75 range, for much of 2016. Around about summer of
2016, the sales rank began to turn up again, hitting number 1 status
as the opening of the movie drew near.
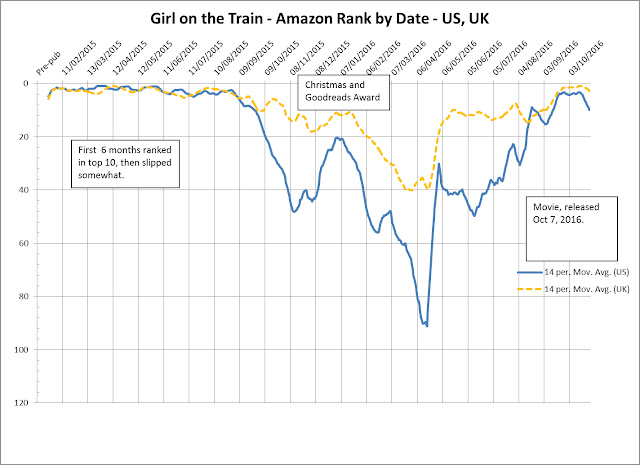
In the second graph, below, I have focused on the U.S. and U.K.
Amazon stores, and used a 14 day moving average. Those
simplifications are to help make these trends more obvious. Note
that the Y-axis is reversed in both graphs, since these are ranks.
The next two graphs tell a similar story, but using estimated sales
figures rather than ranks. The rank to sales conversion is based on
an Indie writer crowd sourced rankings to sales power law. For the
sake of full disclosure, the formula was:
Sales = 12020 X Rank -0.719
This applied to U.S. sales. Sales for the U.K. were adjusted
downwards by dividing by 3 (to account for the smaller populations).
Canada and Australia were similarly adjusted to account for their
smaller populations. Naturally, that will just be a rough estimate
of actual sales, which only Amazon and the publisher actually know
for sure. But, for the sake of getting a general picture, it should
be useful.
As with sales rank, the estimated sales graph shows that the book
sold strongly through most of 2015, then fell off by autumn.
Christmas and the Goodreads award provided a lift, but it was the
buzz around the opening of the movie, then the opening itself, that
really had an effect, as sales climbed back to the levels of the
book’s first months after publishing. However, that effect now
seems to be wearing off.
The 14 day moving average, shown below, also indicates that the movie
gave the book a boost, but it is now falling back to normal levels.
So, it appears that having your best-seller made into a movie will
give a jolt to book sales, but that effect is not necessarily long
lasting.
The graph also shows an interesting quasi-periodic effect in the
first year’s sales, which appear to have peaks and valleys,
essentially on a monthly basis. Perhaps it is a “mid-month
paycheque” effect, whereby sales spike during those weeks when the
rent and other bills don’t have to be paid.
Now, let’s look at the movie and book together. Note that the
source for the movie’s revenues is the website boxofficemojo.com.
The first graph, below, shows the sales of the book before and after
the opening of the movie, as well as movie revenue. The movie is the
thick line, and its scale is on the left vertical axis. The book is
the thinner line, with its scale on the right vertical axis. As you
can see, book sales rose before the movie opened, probably in
anticipation of the movie. Evidently, many people who intended to
see the movie also wanted to read the book, before the movie came
out, in preparation.
The next graph looks at the fortunes of the movie and book, after the
movie opened. It is scaled to an index number, with book and movie
revenue both set to the index 100, on the movie’s opening day.
That allows us to compare the two products, on the same scale.
It appears that the movie’s fortunes decline faster than do the
book’s, as might be expected. After all, once the movie’s
popularity wanes, it begins to be taken out of theaters, and is
therefore less available to the movie-going public. A book on
Amazon, on the other hand, remains available to the book-buying
public, with little change in accessibility, as long as it doesn’t
fall too far in the Amazon rankings.
As you can see, I also added a trend-line to both the book and the
movie. They both show a pretty good fit to a logarithmic decay curve
In this case, the book had a somewhat better fit than the movie
(R-square=0.83 for the book, 0.76 for the movie).
My sales rank to
sales figure calculation indicates Amazon sales of about 3.5 million books,
mainly in the U.S. and U.K.. That's just Amazon sales, of course. A book like this would have sold a lot of
paper copies in book stores, airports, etc. so you could probably scale that
figure up to at least 10 million copies sold, possibly more. At about $10 per copy, that might well mean
$100 million in revenue. U.S. sales
alone probably account for about 70% of that, so we might ballpark the book’s
U.S. sales at about $70 million.
Interestingly, the
boxofficemojo website gives about $66 million as the U.S. gross for the movie,
up to the end of October. So, it would
appear that the book and movie have generated about the same amount of gross
revenue. Given a book’s low overhead
costs, compared to a movie, the book has probably generated much more pure
profit for the writer and publisher than the movie has for the film company
(and of course the writer should get a cut of the movie profits).
So, that’s my
effort to compare a best-selling book to
its spin-off movie. Naturally, there are
a lot of assumptions there, but given the obscure nature of Hollywood’s and
traditional publishing’s accounting practices, it might be as good a guess as
any.
===========================================================
“The Girl on the Train” is an interesting
read, about troubled people with dark secrets. But if you would like some
romance and science fiction adventure with a lighter touch, try “the girl on
the drowned planet”, Kati of Terra. It
would make a great movie, too. (After
you have read Kati 1, you can email me for inquiries as to movie rights). :)


No comments:
Post a Comment