One Year of Solar Energy
Dodecahedron
Books is your best bet for sustainably produced ebooks, with nearly all of our
electricity produced by solar power. :)
You can see that in the graph below.
Actually
this graph represents a single household’s power production and use throughout
one year, from summer solstice to summer solstice – that’s because we run
Dodecahedron Books from our home. But,
all the energy used to write and format the books is in there somewhere – of
course the energy that Amazon uses to distribute the books and that readers use
to read the books is another matter, but we can’t control those things.
Our system
consists of 16 panels, each about 1 meter by 2 meters (a bit smaller actually), that are rated to produce 280
watts each when perpendicular to the sun’s rays under a clear sky, on a
temperate day. The panels are located in
two arrays on the garage, east and west side, with a roof pitch of about 25
degrees. The garage centre line runs
north-south. So, in the morning, the
east side generates the most power, in mid-day both sides do, and in the
afternoon it is the west side that produces the most power. The house is located in central Alberta,
Canada, so it is pretty far north – at about the 54th parallel of
latitude. That means we produce a lot
more in the summer than the winter, but over the course of the year we send
almost as much to the grid as we receive, as the graph above indicates.
In our
area, we have a grid-tie system.
Basically, when the panels produce power, the power goes to the house,
which gets first call on the power. Any
excess is sent to the grid, adding to the system’s total power, just like any
other power generator. When the house
uses more power than the panels produce, power is drawn from the grid.
 The graph above
includes that “phantom power” that goes directly to the house, and is not
captured by the electric meter. I
estimated the amount produced to the house, from electrical bills in previous
years, assuming that the house’s usage has remained approximately constant. Operationally,
this is calculated as:
average daily KWhrs for that time period – KWHrs
taken from Grid
So, for
example, if the house had historically used 13 KWHrs per day during the first
half of April, and drew 7 KWhrs from the grid, that would imply that the solar
panels supplied 5 KWhrs directly to the house, and the remaining power that
they produced went out to the grid.
Obviously,
this means that power production peaks during the height of summer and drops very
low during the depths of winter.
However, as the graph shows, even in December and January, the panels
send power to the house, though not enough to supply all needs. Our winters are cold, but they are often sunny. Tiltable panels, that could be optimized for
the different seasons, would help quite a bit.
Of course,
from day to day, the power production fluctuates according to the cloud
cover. This can be seen in the graph
below. As you can see, on some days no
power is produced (extremely rainy and overcast days), while on others a
substantial amount is produced (bright sunny summer days).
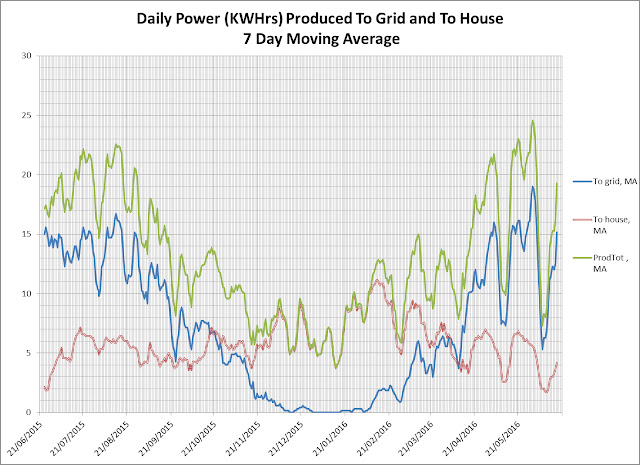
If we look
at a 7 day moving average (that’s the average of the three days before and
after a given day, as well as that day), the data is smoothed out
considerably. The graph below shows that
data. That would be most relevant for
someone considering going off the grid, via something like Elon Musk’s
Powerwall batteries. However, even with
that, at norther latitudes you would still have a problem generating sufficient
power, likely needing a backup supply of some kind (e.g. a small diesel
generator).
The graph
above also shows a nice summary of the local weather. The long days of June and July don’t produce
nearly as well as one might expect; that’s because we often have quite a bit of
rainy weather during those times (it does make for an excellent climate for
growing crops and gardens, though).
Conversely, though autumn days are relatively short, they can be very
sunny and clear, with very little obscuring dust or haze, and therefore can
generate more power than expected.
I will look
at some other aspects of the data in another blog.
In Kati of Terra’s universe, the more advanced planets make great use of sustainable energy. Read them and find out more :).
Kati 1 - Escape from the Drowned
Planet
Kati and Mikal's escape from the alien slaver Gorsh.
Amazon U.S.: https://www.amazon.com/dp/B00811WVXO
Amazon U.K.: https://www.amazon.co.uk/dp/B00811WVXO
Kati 2 - On Assignment on the Planet of the Exalted
Kati and Mikal follow the trail of justice to the planet Vultaire.
Amazon U.S.: https://www.amazon.com/dp/B00D0H15CC
Amazon U.K.: https://www.amazon.co.uk/dp/B00D0H15CC
Kati 3 - Showdown on the Planet of the Slavers
Kati and Mikal must battle Gorsh on his home turf.
Amazon U.S.: https://www.amazon.com/dp/B00KHBN8FG
Amazon U.K.: https://www.amazon.co.uk/dp/B00KHBN8FG


No comments:
Post a Comment