Monday, 14 March 2016

PI Day 3.14.16 – Some Eerie Pi coincidences


PI Day 3.14.16 – Some Eerie Pi coincidences
Another year, another PI Day, which as we all know is March 14, using the U.S. system of calendar date nomenclature. In fact, this year is 3/14/16, which is pi rounded to 4 decimal places (3.1416, rounding of 3.14159). That's a nice pi-related coincidence. Here are a few more.
First off, let's recall the most interesting point about transcendental and irrational numbers: they never end and never repeat. Or, as Spock says about pi in “Wolf in the Fold”: "the value of pi is a transcendental figure without resolution".


A pi related calculation, eerily close to an integer

This one is courtesy of the XKCD internet comic.
epi – PI = 20.00 (actually it is 19.9991)
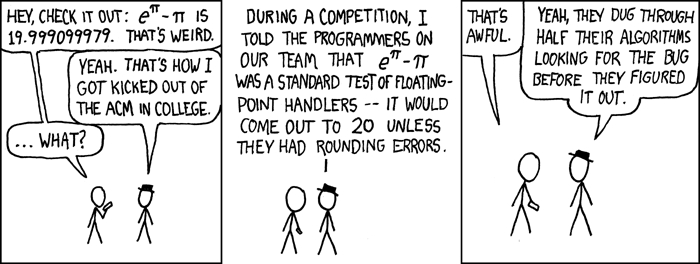

  This one is seemingly strangely significant, being so close to the integer 20. But, it can't really have a deep meaning, can it?. Since e and pi are both transcendental numbers, e raised to the power pi must also be transcendental, or at least irrational. Then, subtracting an infinite non-repeating number (pi) from another infinite non-repeating number (e to the pi), you should never be able to come up with an integer, unless the first number was the same as the second (i.e. pi), with some integer added to it.
Which seems to be impossible, though it might be difficult to prove – or not, but there's no time left before Pi Day, so I'll leave it at that. Besides, I am a data analyst and this is a job for a pure math type.
I suppose there must be an infinite number of similar examples, where transcendental valued functions like this almost result in integers. Anyway, a better mathematician than me can probably prove all that. :)

Some interesting coincidences in expansions of transcendentals and/or irrationals

We can look at the decimal expansions of some famous transcendental or irrational numbers, to see where approximations of other numbers show up. There are a number of internet sites that allow you to plug in a number, and see where the first occurrence of that number is within a long decimal expansion of the transcendental or irrational number.
Here are some examples, using pi, e (the base of the natural logarithms), the square root of 2, and phi (the golden mean 1.61803):
Pi = 3.14159. If we look for the first occurrence of the string 314159 in the decimal expansions of the numbers listed above, we get:
For pi itself: 176,451 (i.e. if you go 176451 places out in pi, you will come to the string 314159).
For e: 1,436,935
For square root of 2: 199,409
For phi, 607,276
e = 2.71828. If we look for the first occurrence of the string 271828 in those numbers, we get:
For pi: 33,789.
For e: 252,474.
For square root of 2: 1,827,315.
For phi, 708. 385.
root 2 = 1.41421. If we look for the first occurrence of the string 141421 in those numbers, we get:
For pi: 52,638.
For e: 325,839.
For square root of 2: 110,269.
For phi: 360,709.
Phi = 1.61803. If we look for the first occurrence of the string 161803 in those numbers, we get:
For pi: 144,979.
For e: 389,765.
For square root of 2: 944,257.
For phi: 2,200,371.

The interesting thing about these numbers, is that pi always “wins”. You come across the desired string more quickly in the expansion of pi than in the expansion of the other numbers. Does that make pi somehow a better, or more “complete” infinite number than the others? After all, there are 256 (4X4X4X4) ways to order the sets containing the first occurrence of each string in these numbers. It somehow seems significant that pi always wins, doesn't it. One chance in 256, that's better than a one percent p-value.
Not really, though. Since there are 256 ways to order these numbers, any given ordering is equally unlikely. It is our minds that enforce the significance of pi always coming out on top first – it seems important to us. It would have seemed equally significant if root 2 would have won, or if pi always came in third. In fact, all sorts of combinations would have appealed to the pattern seeking instincts of our minds.
These sorts of post-hoc (after the fact) analyses often seem significant when they really are not. In big data sets you often see unusual runs of numbers, or a correlation between two random variables will pass as statistical significance test, at some given probability level. In a thourogh statistical analysis, you correct for these effects via Bonferroni adjustments and the like, though lots of papers in applied science areas miss that subtley. That's one reason a lot of results are not reproducable, in nutrition studies and the like.
Anyway, if that happens in large but finite datasets, how much more scope then, in infinite numbers, for these uncanny coincidences? Well, infinite scope, I suppose.
Here's a paper by a professor at Florida State University on a related theme, testing the randomness of pi, e, and root 2:
Finally, here's a nice pie chart about Pi Day.

 ------------------------------------------------------------------------------------------------------------------
Oh, and here's a "buy my book" pitch.  There isn't much math in it, but one of the characters (me) is a statistician, so there's that.  Plus, it's a road trip, and they're fun: 
It's mid-March, and the sun is beginning to come on noticeably stronger in the more temperate regions. Spring is around the corner now, and that brings on thoughts of ROAD TRIP. Sure, it is still a bit early, but you can still start making plans for your next road trip with help of “On the Road with Bronco Billy”. Sit back and go on a ten day trucking trip in a big rig, through western North America, from Alberta to Texas, and back again. Explore the countryside, learn some trucking lingo, and observe the shifting cultural norms across this great continent. Then, come spring, try it out for yourself.


It’s on Amazon, 99 cents.


Tuesday, 8 March 2016

Twitter – Optimal Tweeting (according to Dan Zarella)


Twitter – Optimal Tweeting (according to Dan Zarella)

http://www.amazon.com/The-Science-Marketing-Proven-Strategies/dp/1118138279


A while back, I got a book from my Skillsoft learning library, with the following title: The Science of Marketing: When to Tweet, What to Post, How to Blog, and Other Proven Strategies.  As a statistician/analyst at a university, I was curious about how the statistical techniques that I use on a routine basis are applied in the marketing and social media world.  The author, who works with Hubspot as a social media scientist, examines several of the more popular social media platforms, via large data sets, to see what really works.

The book was written in 2013, so some of the findings may no longer apply, since the social media world is a fast moving world.  Nonetheless, I found them interesting, especially the Twitter chapter.  I summarize some of his results below, with my own thoughts in italics.

Naturally, if the book interests you, you should go to the source.  The Amazon link is given above.  The book sells for about 13 bucks, and about 20 bucks in paper.  Note that he also delves into many other social media platforms and strategies, so the Twitter stuff is only a small part of the book’s content.

 Below are some his results, many of which are controversial by his own admission:

Regarding Tweets and Followers

·         Engaging in conversation does not generally lead to more followers.   In fact, his analysis of many millions of tweets and accounts shows that “highly followed accounts tend to spend a lower percentage of their tweets replying to other accounts”.
o   Accounts with 1000 or more followers had about 8% of their tweets preceded by the @ sign (i.e. were conversational).  Accounts with less than 1000 followers had about 16% of their tweets preceded by the @ sign.  A similar trend was evident when examining accounts with greater than a million, vs less than a million followers.
o   This seems reasonable, given the difficulty of actively engaging with a large number of followers.  After all, a twitter account holder only has so much time and attention.  The more time devoted to conversation, the less time that can be devoted to more the more general content, that builds audiences.
 ·         Highly followed accounts tend to have a lot of tweets that contain links.

o   For accounts with 1000 or more followers, about 45% of the tweets contained links.  For accounts with less than 1000 followers, only about 12% of tweets contained links.

o   This also seems reasonable.  An account that appeals to a large following probably can’t be too personal – there are just too many people.  But it can be informative, interesting, educational or authoritative on some subject.  That is what can generate followers (unless you are a celebrity, in which case the minutiae of your life may hold wide appeal).

·         More tweets are better for building an audience.

o   When he looked at the number of tweets per day, vs the number of followers that the account had, the number of followers peaked at about 22 tweets per day.  It didn’t fall off very quickly from that point.  So, the takeaway is, it is hard to over-tweet.

o   This also seems reasonable, at least within certain parameters.  You need to repeat messages, to have them heard in a crowded room.  But, you have to avoid coming across as a spammer – it alienates people and Twitter doesn’t like it.  Rich content also helps – if the content is good, repetition is probably tolerated better.

·         Accounts with a higher percentage of self-referential tweets have fewer followers than accounts that don’t talk about themselves too much.

o   This also seems reasonable.  You had better be an intrinsically interesting person, if you expect a lot of people to be hanging on your every thought or action.  Again, what works for celebrities doesn’t work so well for the rest of us.

·         Accounts with a higher percentage of negative sentiment have fewer followers than accounts that are more positve.

o   Again, this seems intuitively obvious.  Most people don’t care for a lot of negativity (though a smattering of it is ok).

·         Accounts with a picture/bio/profile get more followers (250 on average vs 25).

o   Again, this seems intuitively obvious.  It is harder to trust people who seem to be holding back.  Of course, not including a picture/bio/profile might also be a sign that the account holder isn’t all that social, anyway.

Regarding Retweets

·         Tweets with links get more retweets than those without links.
o   That seems reasonable, as retweets are often about sharing content.
·         People retweet tweets with links, even though they don’t necessarily click on the link themselves.  So, a catchy headline is important.
o   Interesting, and rather counter-intuitive.
·         Asking for retweets is effective.
o   Calls to action work.
·         Tweets made in the late afternoon (3-5 Eastern Time) get a higher percentage of retweets, than other times of the day.
o   People are tired at the end of the day, so retweeting is a nice way to stay engaged without working too hard.
·         Retweeting peaks on Friday, though tweeting in general peaks earlier in the week.
o   Similar to above.
·         Tweets with novel or unusual content get more retweets.  This was determined via text analysis (the percentage of words in a tweet that were not common words).
o   People like to be the first to share new information.
  

Regarding Click-through Rates (CTR, or the tendency to click on the link or tweet, rather than just read it)

·         Longer tweets have higher CTR.
o   Longer tweets are more likely to have something “clickable” to look at.
·         Tweeting at widely spaced intervals through the day leads to higher CTRs.
o   Quick bursts of tweets are more likely to have at least some of them missed (maybe people are busy clicking on the previous tweet?).
·         Tweets with more action words (i.e. verbs and adverbs) have higher CTRs.
o   Similar to the “call to action” phenomenon?
·         Tweets on weekends had relatively high CTRs.
o   People have more time to click through and read content on the weekend.
I should note that some reviewers objected to referring to these findings as “science”, since they are correlational in nature, and therefore don’t really speak to causation.  That’s true – findings based on observational data frequently have that knock against them.  But, given the nature of the phenomenon, it is difficult to set up experiments, so it seems to me that observational data is the best one can hope for.  Better that, than theorizing uninformed by data.
-------------------------------------------------------------------------------------------------------------
And since calls to action work, I should include one in the blog, for one of our books.  Since spring is approaching, and I know people interested in Twitter  are great lovers of novelty and new experiences, here's a plug for a travel book, about a hiking trail on the west coast of Canada:
 The hiking journal "A Walk on the Juan de Fuca Trail" is available on Amazon for 99 cents. Here is a summary.

The Juan De Fuca Marine is considered by many to be one of Canada’s finest hiking trails. It hugs the southwestern shore of Vancouver Island, between Jordan River and Port Renfrew for a distance of about 48 kilometres. Like its (perhaps) more famous neighbouring hiking trail just to the north, The West Coast Trail, it features both beach and forest hiking along a rugged coastline. The hiking is a nice test of one’s fitness, the views are spectacular, the wildlife (marine and forest) is plentiful and the people are friendly. What more could one ask for? 


 What follows is a journal of a five day trip, taken in early September of 2002. It is about 13,000 words in length (60 to 90 minutes reading), and contains numerous photographs of the trail. There are also sections containing a brief history of the trail, geology, flora and fauna, and associated information.


Tuesday, 1 March 2016

One Year with Harper Lee’s To Kill a Mockingbird and Go Set a Watchman, Part 2


One Year with Harper Lee’s To Kill a Mockingbird and Go Set a Watchman, Part 2

As most people must have heard by now, Harper Lee died a little while ago (Feb 19, 2016).  Earlier, I published a blog following her Amazon sales rank and imputed sales over the past year (Feb 2015 to Feb 2016), noting how sales corresponded to some key events over the year.  This companion blog looks at how the number of Amazon reviews corresponded to those key events.  It also performs some analysis on the relationship between the Sales Rank and the number of reviews, for these two books, To Kill a Mockingbird and Go Set a Watchman.


As a reminder of that blog, and for context, the graph below shows how the sales rank of To Kill a Mockingbird (TKAM) and Go Set a Watchman (GSAW) varied over the time span from early February 2015 to late February 2016, a period of a little over a year.


1 – Number of Amazon Reviews and Key Events over the Year

The graph below shows the total number of reviews recorded on the Amazon site, by date for the period from early Feb 2015 to early Feb 2016.  The same key events are outlined, as was done for the sales rank graph.


The first key event was the announcement that a new book by Harper Lee was in the works, in early February 2015.  As you can see, the slope of the curve for TKAM reviews increased (the blue line gets steeper), when that announcement was made, indicating that interest was piqued, as reflected by people’s propensity to leave a review.


The next key event was the pre-release of GSAW in late May 2015, followed by publication in early July 2015.  The pre-release of GSAW didn’t do much, if anything, for the review numbers of TKAM.  However, they did pick up with the release of the new book (again, the slope of the blue line increases).  Naturally, once GSAW was released, the number of reviews shot up very quickly, along with sales, of course.  The rapid increase in reviews would seem to indicate that there was a lot of latent interest in the new book.


Reviews for GSAW began trailing off at about the beginning of October, as indicated by the diminishing slope of the red line.  An inflection point happened sometime in October, with the line bending back down.  The slope of the blue TKAM line also diminished about this time, though the effect is rather slight.


The next major event happened in December, when GSAW won its category in the Goodreads Book of the Year (2015) rankings.  That, and Christmas, seems to have turned the line back upwards, with an inflection point some time in January.  The pace of reviews for TKAM didn’t appear to change much, if at all. 


Then, of course, we come to Ms. Lee’s death. A funny thing happens almost immediately - Amazon takes away about 1700 reviews, overnight, on Feb 21, 2016.  That’s why the blue line takes a sudden plunge, a discontinuity.  


One wonders just what happened here.  Many Amazon authors have had the experience of having reviews taken away by Amazon, especially we Indies with modest sales.  The explanation for this is generally that the reviewer had some kind of family or commercial relationship with the writer or the publisher.  Presumably the same thing must be at work here.  Since Harper Lee probably didn’t have 1700 “bogus” reviews from her family and friends, it is natural to assume that this must relate to the publisher.  Had the publisher salted in all these reviews?  Or is some other explanation at work.  I suppose that we will never know.


Anyway, after that the TKAM line resumes, and the rate of reviews seems to increase modestly.  GSAW, on the other hand, doesn’t seem to be much affected by the writer’s death.


In the last blog, I noted that death did seem to be a good career move, in terms of sales.  But the effect was not long lasting.  Both books are now in the 300-400 rank range.  It probably wont’ be long before they reach their baseline level, somewhere in the 800 to 1000 rank range.


The graph below gives a day by day count of the number of reviews for each book, rather than a running total, along with the key events during the year.  It can also be correlated with the comments in the text above.  This format makes some things clearer, but others more obscure (hidden by the day to day noise of the time series).  By the way, I cut off the data before the big TKAM recalculation of reviews, as it distracted from the other aspects of the graph, given the scale of that one day change.


2 – Sales Rank versus Number of Reviews

As a data analyst, I am always interested in exploring relationships among variables.  In this case, I will look at just how sales rank and number of reviews were related, for these two books during the time period in question.


The first graph shows the average sales rank during a given ten day period for TKAM, versus the number of reviews that the book received during that same ten day period.  As you can see, there does seem to be a definite relationship - a lower sales rank (more sales) corresponds to a higher review rate (more reviews).  This is as one would expect.  You need sales to get reviews, but reviews can also trigger sales, due to the “social proof” that people tend to assume from the mere presence of reviews.


I used Excel’s trend-line option to test a few different functional forms, to the relationship.  The best fit was given by an exponential function.  Basically, that implies that the slope of the relationship is highest when the sales rank is lower, and weakens with increasing rank.

I should note that removing the outlier at approximately x=100, y=45 only improves the model R-square a bit, increasing it from 0.742 to 0.767.  An R-square of 1.00 implies a perfect positive fit, while an R-square of 0.00 implies no relationship, and an R-square of -1.00 implies a perfect negative fit.  So, this is a pretty decent fit.


We can now go on to look at whether the fit gets better or worse, if we compare sales rank at period T with sales rank at period T+1 (using ten day period averages).  In other words, we are testing how strongly sales predict later reviews.  When we do that we see that the fit gets worse, with the R-square dropping from .742 to .511, for the exponential functional form.


I then tried the other alternative - testing sales rank at period T against number of reviews in period T-1.  In other words, that tests how strongly reviews predict sales. In this case, the R-square was .567, which is greater than the previous case, but less than the case where sales rank and number of reviews are drawn from the same time period.


So, it would seem that the relationship between sales rank and reviews is:

·         strongest when the two are close together in time,

·         next strongest when reviews lead sales rank

·         then weakest when sales rank lead reviews.


Naturally it would be best to do a multiple regression to pin this down further, but as a first level qualitative result it is still useful.


The results were substantially similar, when looking at sales rank and reviews for GSAW, though a logarithmic function proved to have the best fit:

·         strongest when the two are close together in time (R-square=.731),

·         next strongest when reviews lead sales rank (R-square=.650)

·         then weakest when sales rank lead reviews (R-square=.686).


So, to sum up:


·          The key events in the year (announcement of new book, publishing of new book, award to new book, author’s death) tended to correspond in increases in sales and reviews for both books, “To Kill a Mockingbird” and “Go Set a Watchman”.


·         There were some unusual re-jiggings of reviews by Amazon, especially for “To Kill a Mockingbird”, where about 1700 reviews were pulled, shortly after Harper Lee’s death.


·         Sales rank and reviews were related, in a non-linear fashion.  The best fit relationship was given when both variables were within the same ten day time period.


================================================================

Finally, of course, I should remind you that you can buy one of our Dodecahedron Books titles.  Since Harper Lee wrote about the social and racial complexities of the American experience, I will offer up “On the Road with Bronco Billy”, a travelogue and cultural study of late 20th century America, as seen from the cab of a big rig.  It also includes some observations on race and class in America, though not with so fine a literary touch as Harper Lee’s books.  J

On the Road with Bronco Billy - A Trucking Journal

Kindle Edition


What follows is an account of a ten day journey through western North America during a working trip, delivering lumber from Edmonton Alberta to Dallas Texas, and returning with oilfield equipment. The writer had the opportunity to accompany a friend who is a professional truck driver, which he eagerly accepted. He works as a statistician for the University of Alberta, and is therefore is generally confined to desk, chair, and computer. The chance to see the world from the cab of a truck, and be immersed in the truck driving culture was intriguing. In early May 1997 they hit the road.
Some time has passed since this journal was written and many things have changed since the late 1990’s. That renders the journey as not just a geographical one, but also a historical account, which I think only increases its interest.

We were fortunate to have an eventful trip - a mechanical breakdown, a near miss from a tornado, and a large-scale flood were among these events. But even without these turns of fate, the drama of the landscape, the close-up view of the trucking lifestyle, and the opportunity to observe the cultural habits of a wide swath of western North America would have been sufficient to fill up an interesting journal.

The travelogue is about 20,000 words, about 60 to 90 minutes of reading, at typical reading speeds.